Agilent PSA Series Spectrum Analyzers Noise Figure Measurements Personality Technical Overview with Self-Guided Demonstration Option 219 The noise figure measurement personality, available on the Agilent PSA Series spectrum analyzers, provides a suite of noise figure and gain measurements including system calibration.
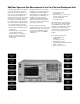
Add Noise Figure and Gain Measurements to Your Set of Test and Development Tools A key measurement in the development of devices and systems is its noise figure. The overall noise figure of a system is one of the limiting factors in its performance. Making noise figure measurements can be a tedious manual process. But with Agilent’s noise figure measurement systems, these measurements can be fast and easy with accurate results. Meet many of your measurement needs with a one-analyzer solution from Agilent.
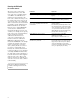
Demonstration preparation To perform the following demonstrations, the PSA requires these options. Product type Model number Required options PSA Series spectrum analyzer E4440A/43A/45A/46A/48A Option 1DS built-in preamplifier Option 219 noise figure measurement personality To configure the measurement system, simply connect the noise source (Agilent 346C) to the rear panel connector labeled “noise source drive out + 28 V (pulsed)” using a 1 meter BNC cable (50 Ω).
Entering the ENR table for a noise source The noise source used for this demonstration is the 346C. This noise source has a calibrated range of 10 MHz to 26.5 GHz. There is a pulsed 28 V source that drives the noise source. When the voltage is on, the output of the noise source is the excess noise value. Once calibration data is entered into the measurement personality, system calibration and DUT measurements can be made. In most cases a common ENR table can be used for calibration and measurements.
Calibration of the noise figure measurement personality In order to make accurate measurements, the personality must first be calibrated. Calibration is required because the NF of the measurement system has to be known before a DUT can be measured. The measured instrument noise figure is then removed from the total noise figure measurement so that only the DUT noise figure and gain is displayed. Following is the calibration process: 1. Select the frequency range. 2.
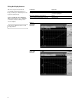
Using the display features The noise figure measurement personality has many features to help you interpret and analyze noise figure measurements. Select and Zoom Active Window: This feature allows you to highlight a window and then enlarge it for closer analysis. This exercise illustrates the use of the display features. Instructions Keystrokes Highlight the window of interest. Press [Next Window] until the window you want is highlighted. Enlarge the window for closer analysis.
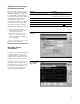
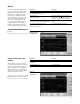
General, markers and source tabs There are three tabs available at the bottom of the screen. These tabs are accessed using the left and right arrow keys. The General tab shows information about BW, number of points, Tcold value, loss, attenuator setting and internal preamplifier setting. The Marker tab gives the frequency, noise figure and gain of each of the markers. The Source tab includes information about the noise source including serial number and model identification.
Scale and reference level values The scale in dB per division and the reference values can be adjusted to give an optimized view of the measured results. The scale per division can be adjusted in 0.1 dB steps from 0 to 20 dB. The reference level can be placed at the top of the graph, in the center or at the bottom. The reference level is adjustable in 0.1 dB steps from –100 dB to +100 dB. Use the Auto Scale feature to give the broadest view of the measured trace.
Markers A total of four normal markers can be placed on the graphical display. The placement of the markers is limited to the calibration points. If there are 11 calibration points then the markers can be placed on each of the vertical graticule lines. Each of the normal markers can be changed to delta markers. For example, marker 2 will change to marker 2 and 2R where 2R is the reference and 2 would be the delta. This exercise illustrates the use of markers.
Creating limit lines Up to four limit lines can be set, two for the upper graph and two for the lower graph. The limit lines for the upper graph are designated with up arrows, and the limit lines for the lower graph are designated with down arrows. The limit lines can be designated as upper limit or lower limit and each can have a test pass/fail indicator. Instructions Keystrokes Open the limit line editor. Select upper limit for the upper graph and turn on the limit test.
Noise figure uncertainty calculator When making a noise figure measurement, there are many aspects of the measurement setup that can affect the uncertainty of that measurement. The instrument uncertainty is one element of measurement uncertainty where the instrument itself adds to the measurement uncertainty; this is the instrument uncertainty we read in the specifications. Other factors like the noise source and the system mismatch also add to the measurement uncertainty.
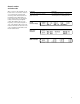
Noise figure measurements using a mixer as the DUT When a down conversion is included in the noise figure measurement, for example measuring the noise figure of a mixer, there are some additional setups to consider. For this example let us use a mixer as a down-converter with an IF at 70MHz, LO at 1GHZ and both RF sidebands are used, 930 and 1070 MHz (DSB): • The measurement, as well as calibration, is made at the IF frequency.
Measurements using a mixer as part of the system In this application the mixer is part of the noise figure measurement system. The diagram below shows the DUT and the mixer as the down converter. The DUT in this case is an amplifier. When using a mixer as part of the measurement system, calibration is performed with the mixer in the path. As in the illustration above, 70 MHz is used as the IF and a band pass filter is added to the IF out of the mixer.
PSA Series Key Specifications Noise figure measurement personality (200 kHz to 26.5 GHz) Noise figure Frequency range 200 kHz to 10 MHz ENR 4 to 7 dB 12 to 17 dB 20 to 30 dB (With internal preamp 1DS) Meas. range Instr. uncertainty (nominal) (nominal) 0 to 20 dB ±0.05 dB 0 to 30 dB ±0.05 dB 0 to 35 dB ±0.10 dB Frequency range 10 MHz to 3 GHz ENR 4 to 7dB 12 to 17 dB 20 to 22 dB (With internal preamp 1DS and 1 MHz RBW) Meas. range Instr. uncertainty 0 to 20 dB ±0.05 dB 0 to 30 dB ±0.05 dB 0 to 35 dB ±0.
PSA Series Ordering Information PSA Series spectrum analyzer E4443A E4445A E4440A E4446A E4448A 3 Hz to 6.7 GHz 3 Hz to 13.2 GHz 3 Hz to 26.
Product Literature Selecting the Right Signal Analyzer for Your Needs, selection guide, literature number 5968-3413E PSA Series literature PSA Series, brochure, literature number 5980-1283E PSA Series, data sheet, literature number 5980-1284E NFA Series literature NFA Series Configuration Guide, literature number 5980–0163E NFA, brochure, literature number 5980–0166E NFA Series Demonstration guide, literature number 5980–2028E Application literature 10 Hints for Making Successful Noise Figure Measurement