
Specifications


10
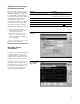
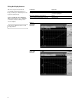
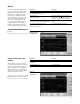
Figure 11.
Display of limit line
Up to four limit lines can be set, two
for the upper graph and two for the
lower graph. The limit lines for the
upper graph are designated with up
arrows, and the limit lines for the
lower graph are designated with
down arrows. The limit lines can be
designated as upper limit or lower
limit and each can have a test
pass/fail indicator.
Instructions Keystrokes
Open the limit line editor. Select upper limit for [Display] {Limits} {Limit Line 1} {Edit...}
the upper graph and turn on the limit test. Use right/left tab keys under display to highlight
“Limit”. Press {On}, tab to Type, press {Upper},
Display {On}, Test {On}.
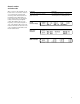
Insert limit values for 10 MHz, 1, 2 and 3 GHz Use right/left tab keys to highlight point 1.
(Figure 11). {Frequency} [10] {MHz} {Limit Value} [5] {dB}
{Connected Yes} {Point 2} {Enter}
{Frequency} [1] {GHz} {Limit Value} [6] {dB}
{Connected Yes} {Point 3} {Frequency} [2] {GHz}
{Limit Value} [6.5] {dB} {Connected Yes}
{Point 4} {Frequency} [3] {GHz}
{Limit Value} [7] {dB} {Connected Yes}
Creating limit lines
This exercise develops limit lines.