
Specifications


9
This exercise illustrates the use of
markers.
A total of four normal markers can
be placed on the graphical display.
The placement of the markers is
limited to the calibration points.
If there are 11 calibration points
then the markers can be placed on
each of the vertical graticule lines.
Each of the normal markers can
be changed to delta markers. For
example, marker 2 will change to
marker 2 and 2R where 2R is the
reference and 2 would be the delta.
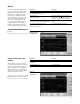
Markers
Illustrating more of the display features.
The default view of the window is
the graphical mode with noise figure
in the top and gain in the bottom.
The two graphs can be combined to
display both traces on one graph.
There are two other views available
table mode and meter mode.
Change format of the active
window
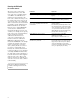
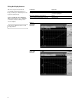
Figure 9.
Display of markers
and delta markers
Instructions Keystrokes
The marker function operates the same as To turn marker on, press [Marker].
the standard E4440A series PSA.
Turn on marker 2. Press {Select Marker 2
} and press {Normal}.
Active delta marker 2. First place the marker to a reference point
using knob or up/down arrows. Press {Delta}.
The marker table under the graphical display Move the marker relative to the reference
reflects the delta marker information (Figure 9). marker.
Switch between displaying the absolute Press {Delta Pair}. Note the change in
frequency of the delta marker and the frequency above the graphical display.
reference marker frequency.
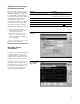
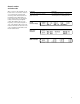
Figure 10.
Full screen of the
combined mode
Instructions Keystrokes
To combine both traces on one graph, [Trace/View] {Combined on}
see Figure 10.
Activate the table mode. [Trace/View] {Table}
Activate the meter mode. [Trace/View] {Meter}