
User Manual
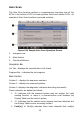
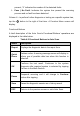
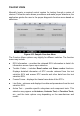
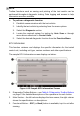
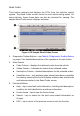
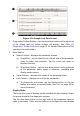
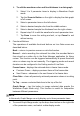
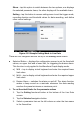
Table Of Contents
- Trademarks
- Copyright Information
- Disclaimer of Warranties and Limitation of Liabilities
- For Services and Support
- Safety Information
- Safety Messages
- Safety Instructions
- 1 Using This Manual
- 2 General Introduction
- 3 Getting Started
- 4 Diagnostics
- 5 MaxiFix
- 6 Shop Manager
- 7 Data Manager
- 8 Settings
- 9 Update
- 10 Support
- 11 Academy
- 12 Remote Desk
- 13 Quick Link
- 14 Function Viewer
- 15 Maintenance and Service
- 16 Compliance Information
- 17 Warranty

31
1. Diagnostics Toolbar Buttons – tap the drop-down button at the top center
of the screen and the toolbar buttons will display. See Table 4-2
Diagnostics Toolbar Buttons on page 21 for detailed descriptions of the
operations for each button.
2. Main Section
Name Column – displays the parameter names.
a) Check Box – tap the check box on the left side of the parameter
name to make item selection. Tap the check box again to
deselect the item.
b) Drop-down Button – tap the drop-down button on the right side
of the parameter name opens a submenu, providing data
display mode options.
Value Column – displays the values of the parameter items.
Unit Column – displays the unit for the parameters.
To change the unit mode, tap the Setting button on the top
toolbar and select a required mode. See Unit on page 68 for
more information.
Display Mode
There are four types of display modes available for data viewing. Select
the proper mode for the diagnostic purpose.
Tap the drop-down button on the right side of the parameter name to
open a sub menu. There are four buttons to configure the data display
Figure 4-14 Sample Live Data Screen