
Programming Guide
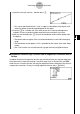

20050401
kk
kk
k Single-Variable Statistical Calculations
In the previous example under “Displaying the Calculation Results of a Drawn Single-
Variable Graph”, statistical calculation results were displayed after the graph was drawn.
These were numeric expressions of the characteristics of variables used in the graphic
display.
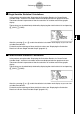
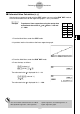
These values can also be directly obtained by displaying the statistical data list and pressing
2(CALC)1(1VAR).
After this, pressing f or c scrolls the statistical calculation result display so you can view
variable characteristics.
For details on the meanings of these statistical values, see “Displaying the Calculation
Results of a Drawn Single-Variable Graph” (page 6-2-4).
kk
kk
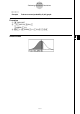
k Paired-Variable Statistical Calculations
In the previous example under “Displaying the Calculation Results of a Drawn Paired-
Variable Graph”, statistical calculation results were displayed after the graph was drawn.
These were numeric expressions of the characteristics of variables used in the graphic
display.
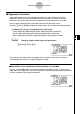
These values can also be directly obtained by displaying the statistical data list and pressing
2(CALC)2(2VAR).
After this, pressing f or c scrolls the statistical calculation result display so you can view
variable characteristics.
For details on the meanings of these statistical values, see “Displaying the Calculation
Results of a Drawn Paired-Variable Graph” (page 6-3-11).
6-4-2
Performing Statistical Calculations