
User manual - Capítulo 0

20000501
0-1-1
Conheçer a calculadora
uGráficos
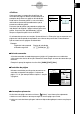
Como regra geral, as operações de gráficos são
mostradas em páginas abertas, encontrando-se os
exemplos dos gráficos nas páginas do lado direito.
Pode realizar o mesmo gráfico na sua calculadora,
realizando os passos dos procedimentos que se
encontram antes do gráfico.
Procure o tipo de gráfico que pretende na página do
lado direito e de seguida a página indicada para esse
gráfico. Os passos dos "procedimentos" utilizam
sempre as especificações iniciais de RESET.
Os números dos passos nas secções "Ajustes básicos" e "Execução" que se encontam nas
páginas do lado esquerdo correspondem aos números dos passos dos "Procedimentos"
que se encontram nas páginas do lado direito.
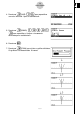
Exemplo:
Página do lado esquerdo Página do lado direito
3.Desenhe o gráfico. 3 5(DRAW)(ou w)
uu
uu
uLista de comandos
A lista de comandos do modo de programa (página 8-7) proporciona uma tabela dos
vários menus das teclas de função e demonstra como chegar ao menu de comandos que
necessita.
Exemplo: A operação seguinte visualiza Xfct: [VARS]-[FACT]-[Xfct]
uu
uu
uConteúdos da página
Números constituidos por três partes encontram-se
centrados no topo de cada página. O número de
página "1-2-3", por exemplo indica capítulo 1, secção
2, página 3,
uu
uu
uInformação suplementar
No final de cada página encontra um bloco “ (Notas)" com informação suplementar.
*
indica uma nota sobre um termo que surge na mesma página que a nota.
# indica uma nota de informação geral sobre um tópico abrangido pela mesma secção que
a nota.
1-2-2
Display
1-2-3
Display
19981001 19981001
Use this mode for arithmetic calculations and function
calculations, and for calculations involving binary, octal,
decimal, and hexadecimal values and matrices.
Use this mode to perform single-variable (standard
deviation) and paired-variable (regression) statistical
calculations, to perform tests, to analyze data and to draw
statistical graphs.
Use this mode to store functions, to generate a numeric
table of different solutions as the values assigned to
variables in a function change, and to draw graphs.
Use this mode to store graph functions and to draw
multiple versions of a graph by changing the values
assigned to the variables in a function.
Use this mode to store recursion formulas, to generate a
numeric table of different solutions as the values assigned
to variables in a function change, and to draw graphs.
Use this mode to draw graphs of implicit functions.
Use this mode to solve linear equations with two through
six unknowns, quadratic equations, and cubic equations.
Use this mode to store programs in th program area and
to run programs.
Use this mode to perform algebraic calculations.
Use this mode for step-by-step solution of expressions.
Use this mode to determine the expression type and
solve mode, and for interactive equation solutions.
Use this mode for step-by-step solution of expressions.
Use this mode to manage data stored in memory.
Use this mode to initialize memory, adjust contrast, and
to make other system settings.
The following explains the meaning of each icon.
Description
Icon
Mode Name
RUN
STATistics
GRaPH-TaBLe
DYNAmic graph
RECURsion
CONICS
EQUAtion
PRoGraM
Computer Algebra
Syetem
ALGEBRA
TUTORial
LINK
MEMORY
SYSTEM
k About the Function Menu
Use the function keys (1 to 6) to access the menus and commands in the menu bar
along the bottom of the display screen. You can tell whether a menu bar item is a menu or a
command by its appearance.
• Command (Example: )
Pressing a function key that corresponds to a menu bar command executes the command.
• Pull-up Menu (Example: )
Pressing a function key that corresponds to a pull-up menu opens the menu.
You can use either of the following two methods to select a command from a pull-up menu.
k About Display Screens
This calculator uses two types of display screens: a text screen and a graphic screen. The
text screen can show 21 columns and 8 lines of characters, with the bottom line used for the
function key menu. The graph screen uses an area that measures 127 (W) × 63 (H) dots.
• Input the key to the left of the command on the pull-up menu.
• Use the f and c cursor keys to move the highlighting to the command you want, and then
press w.
The symbol ' to the right of a command indicates that executing the command displays a
submenu.
To cancel the pull-up menu without inputting the command, press i.
Text Screen
Graph Screen
The contents of each type of screen are stored in independent memory areas.
The contents of each type of screen are stored in independent memory areas.
#The contents of each type of screen
are stored in independent memory
areas.
#The contents of each type of screen
are stored in independent memory
5-1-1
Sample Graphs
5-1-2
Sample Graphs
Set Up
1. From the Main Menu, enter the GRPH • TBL Mode.
Execution
2. Input the function you want to graph.
Here you would use the V-Window to specify the range and other parameters of the
graph. See 5-3-1.
3. Draw the graph.
k How to draw a simple graph (1)
Description
To draw a graph, simply input the applicable function.
Procedure
1 m GRPH-TBL
2 dvxw
3 5(DRAW) (or w)
Example To graph
y
= 3
x
2
Result Screen
19990401 19990401
5-1 Sample Graphs