
User manual - Chapter 5 Graphing

19990401
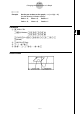
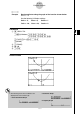
Example Use the pen to draw on the graph y = x (x + 2)(x – 2).
Use the following V-Window settings.
Xmin = –5, Xmax = 5, Xscale = 1
Ymin = –5, Ymax = 5, Yscale = 1
Procedure
1 m
GRPH
•
TBL
!K(V-Window) -fwfwbwc
-fwfwbwi
3(TYPE)b(Y=)v(v+c)(v-c)w
5(DRAW)
2 3(SKTCH)f(Pen)
3 f~f d~dw
4 cd
…
, e~e, ef
…
, d~dw
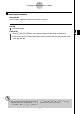
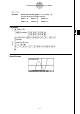
Result Screen
5-10-6
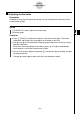
Changing the Appearance of a Graph
19991201