
Programming Guide

20050401
k Graphing a Function Using a List
When using the graphing functions of this calculator, you can input a function such as Y1 =
List 1 X. If List 1 contains the values 1, 2, 3, this function will produces three graphs: Y = X,
Y = 2X, Y = 3X.
There are certain limitations on using lists with graphing functions.
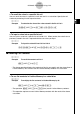
Example To input the data 1, 2, 3 into List 1, and then graph the data in the
GRAPH mode
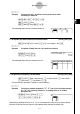
1. In the STAT mode, input 1, 2, 3 into List 1.
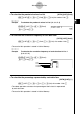
2. In the GRAPH mode, input the formula Y1=List 1X.
K1(List)bvw
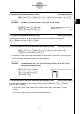
3. Graph the data, which will produce three graphs.
k Inputting Scientific Calculations into a List
You can use the numeric table generation functions in the TABLE mode to input values that
result from certain scientific function calculations into a list. To do this, first generate a table
and then use the list copy function to copy the values from the table to the list.
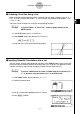
Example To use the TABLE mode to create a number table for the formula (Y1 =
x
2
– 1), and then copy the table to List 1 in the STAT mode
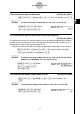
1. In the TABLE mode, input the formula Y1 = x
2
–1.
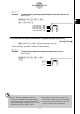
2. Create the number table.
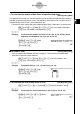
3. Use e to move the highlighting to the Y1 column.
4. Press K1(LMEM).
3-3-4
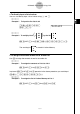
Arithmetic Calculations Using Lists