
Programming Guide


20050401
9-6-4
Statistical Graphs
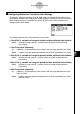
5. Configure the graph setup settings.
• For information about configuring the Graph Type and Mark Type settings, see
“1. General graph settings” on page 6-1-2, “6-2 Calculating and Graphing
Single-Variable Statistical Data”, and “6-3 Calculating and Graphing Paired-Variable
Statistical Data”.
• For information about configuring the Frequency setting, see “Configuring the
Frequency Setting” (page 9-6-6).
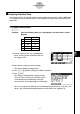
6. After all of the settings are the way you want, press J to exit the graph settings
screen.
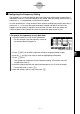
7. Press 1 (GPH1).
• This will draw a graph in accordance with
the StatGraph1 settings.