
User manual - Confidence Interval (INTR)


31
3. Confidence Interval (INTR)
A confidence interval is a range (interval) that includes the population mean value.
A confidence interval that is too broad makes it difficult to get an idea of where the population
value (true value) is located. A narrow confidence interval, on the other hand, limits the
population value and makes it possible to obtain reliable results. The most commonly used
confidence levels are 95% and 99%. Raising the confidence level broadens the confidence
interval, while lowering the confidence level narrows the confidence level, but it also
increases the chance of accidently overlooking the population value. With a 95% confidence
interval, for example, the population value is not included within the resulting intervals 5% of
the time.
When you plan to conduct a survey and then t test and Z test the data, you must also
consider the sample size, confidence interval width, and confidence level. The confidence
level changes in accordance with the application.
1-Sample Z Interval calculates the confidence interval for an unknown population mean
when standard deviation is known.
2-Sample Z Interval calculates the confidence interval for the difference between two
population means when the standard deviations of two samples are known.
1-Prop Z Interval uses the number of data to calculate the confidence interval for an
unknown proportion of successes .
2-Prop Z Interval uses the number of data items to calculate the confidence interval for the
difference between the propotion of successes in two populations .
1-Sample t Interval calculates the confidence interval for an unknown population mean
when the population standard deviation is unknown .
2-Sample t Interval calculates the confidence interval for the difference between two
population means when both population standard deviations are unknown.
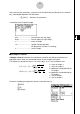
On the initial STAT Mode screen, press 4 (INTR) to display the confidence interval menu,
which contains the following items.
• 4(INTR)b(Z) ... Z intervals (p.33)
c(T)... t intervals (p.38)
# There is no graphing for confidence interval
functions.