Examples
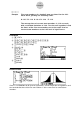
examples k 1-Sample Z Test Set Up 1. On the icon menu, select STAT2. Execution 2. When using list data (List is selected as the Data parameter), be sure to input data into the list first. 3. 3(TEST)b(Z)b(1-Smpl) ... 1-Sample Z Test 4. Set calculation parameters. 5. Align the cursor with [Execute] 1(CALC) ... Performs calculation. 6(DRAW) ... Draws graph.
examples ○ ○ ○ ○ ○ Example Five new members of a football team are timed for the 100meter dash, yielding the following times. A: 12.5 B: 11.6 C: 10.8 D: 12.8 E: 11.4 The average time of current team members is 11.4 seconds, with a standard deviation of 1.30. Test the null hypothesis that the times of the five new members are at the same level as current team members at the 0.05 level of significance. Procedure 1 m STAT2 2 bc.fwbb.gwba.iw bc.iwbb.ew 3 3(TEST) b(Z)b(1-Smpl) 4 1(LIST) c 1(≠) c bb.ew b.
examples k 2-Sample Z Test Set Up 1. On the icon menu, select STAT2. Execution 2. When using list data (List is selected as the Data parameter) , be sure to input data into the list first. 3. 3(TEST)b(Z)c(2-Smpl) ... 2-Sample Z Test 4. Set calculation parameters. 5. Align the cursor with [Execute] 1(CALC) ... Performs calculation. 6(DRAW) ... Draws graph.
examples ○ ○ ○ ○ ○ Example A consumer group is testing camp stoves. To test the heating capacity of a stove they measure the time required to bring 2 qt of water from 50qF to boiling (at sea level). Two competing models are under consideration. 36 stoves of each model were tested and the following results were obtained. Model 1: mean time o1 = 11.5min; standard deviation σ1= 2.
examples k 1-Prop Z Test Set Up 1. On the icon menu, select STAT2. Execution 2. 3(TEST)b(Z)d(1-Prop) ... 1-Prop Z Test 3. Set calculation parameters. 4. Align the cursor with [Execute] 1(CALC) ... Performs calculation. 6(DRAW) ... Draws graph.
examples ○ ○ ○ ○ ○ Example A team of eye surgeons has developed a new technique for a risky eye operation to restore the sight of people blinded from a certain disease. Under the old method it is known that only 30% of the patients who undergo this operation recover their eyesight. Suppose that surgeons in various hospitals have performed a total of 250 operations using the new method and that 93 have been successful (the patients fully recovered their sight).
examples k 2-Prop Z Test Set Up 1. On the icon menu, select STAT2. Execution 2. 3(TEST)b(Z)e(2-Prop) ... 2-Prop Z Test 3. Set calculation parameters. 4. Align the cursor with [Execute] 1(CALC) ... Performs calculation. 6(DRAW) ... Draws graph.
examples ○ ○ ○ ○ ○ Example The County Clerk wishes to improve voter registration. One method under consideration is to send reminders in the mail to all citizens in the county who are eligible to register. As a pilot study to determine if this method will actually improve voter registration, a random sample of 1224 potential voters was taken. Then this sample was randomly divided into two groups. Group A : There were 612 people in this group. No reminders to register were sent to them.
examples k 1-Sample t Test Set Up 1. On the icon menu, select STAT2. Execution 2. When using list data (List is selected as the Data parameter), be sure to input data into the list first. 3. 3(TEST)c(T)b(1-Smpl) ... 1-Sample t Test 4. Set calculation parameters. 5. Align the cursor with [Execute] 1(CALC) ... Performs calculation. 6(DRAW) ... Draws graph.
examples ○ ○ ○ ○ ○ Example A company manufactures large rocket engines used to project satellites into space. The government buys the rockets, and the contract specifies that these engines are to use an average of 5550 lb of rocket fuel the first 15 sec operation. The company claims their engines fit specifications. To test the claim an inspector randomly selects six such engines from the warehouse. These 6 engines are fired 15 sec each and the fuel consumption for each engine is measured.
examples k 2-Sample t Test (Pooled On) Set Up 1. On the icon menu, select STAT2. Execution 2. When using list data (List is selected as the Data parameter), be sure to input data into the list first. 3. 3(TEST)c(T)c(2-Smpl) ... 2-Sample t Test 4. Set calculation parameters. 5. Align the cursor with [Execute] 1(CALC) ... Performs calculation. 6(DRAW) ... Draws graph.
examples ○ ○ ○ ○ ○ Example Two different processes (Type A and Type B) are used to produce tinplate. The following values show the weights of samples produced by each process. Type A: 105 108 Type B: 89 92 86 103 103 107 124 124 84 97 103 107 111 97 Using the level of significance 0.05, test the null hypothesis that the tinplate produced by the two processes are of the same level.
examples k 2-Sample t Test (Pooled Off) Set Up 1. On the icon menu, select STAT2. Execution 2. When using list data (List is selected as the Data parameter) , be sure to input data into the list first. 3. 3(TEST)c(T)c(2-Smpl) ... 2-Sample t Test 4. Set calculation parameters. 5. Align the cursor with [Execute] 1(CALC) ... Performs calculation. 6(DRAW) ... Draws graph.
examples ○ ○ ○ ○ ○ Example Two competing headache remedies claim to give fast-acting relief. An experiment was performed to compare the mean lengths of time required for bodily absorption of brand A and brand B headache remedies. 12 people were randomly selected and given an oral dosage of brand A. Another 12 were randomly selected and given an equal dosage of brand B. The length of time in minutes for the drugs to reach a specified level in the blood was recorded.
examples k LinearReg t Test Set Up 1. On the icon menu, select STAT2. Execution 2. Input data into the list. 3. 3(TEST)c(T)d(LinReg) ... LinearReg t Test 4. Set calculation parameters. 5. Align the cursor with [Execute] 1(CALC) ... Performs calculation.
examples ○ ○ ○ ○ ○ Example A survey conducted by a city on its real estate investments revealed the following data on the relationship between area and price. Does the data indicate that the value β 1, that is, the slope of the population regression line, is not zero, which would mean that x (Area) can be use as a predictor of y (Sales Price)? Use a 5% level of significance.
examples k χ 2 Test Set Up 1. On the icon menu, select STAT2. Execution 2. 3(TEST)d(χ 2)... χ 2 Test 3. Input data into the Matrix. 4. Set calculation parameters. 5. Align the cursor with [Execute] 1(CALC) ... Performs calculation. 6(DRAW) ... Draws graph.
examples ○ ○ ○ ○ ○ Example A certain club collected data on the attendance at meetings by married status, and obtained the data shown below. Married Divorced Widowed Single Row Totals Often Absent 34 16 14 36 100 Seldom Absent 64 34 20 82 200 Never Absent 52 50 16 82 200 Column Totals 150 100 50 200 500 Test the null hypothesis that two phenomena are independent using the level of significance of 0.05.
examples k 2-Sample F Test Set Up 1. On the icon menu, select STAT2. Execution 2. When using list data (List is selected as the Data parameter), be sure to input data into the list first. 3. 3(TEST)e(F)... 2-Sample F Test 4. Set calculation parameters. 5. Align the cursor with [Execute] 1(CALC) ... Performs calculation. 6(DRAW) ... Draws graph.
examples ○ ○ ○ ○ ○ Example There are two possible routes to get to the airport from a certain company, and so manager wants to determine which route is the fastest in order to make a plane that leaves at 7 o'clock. One route was researched five times and then the other route was researched five times, producing the data shown below. mean of x1 = 33.8min mean of x2 = 34.2min x1σn-1 = 16.4min x2σn-1 = 6.
examples k One-Way ANOVA Set Up 1. On the icon menu, select STAT2. Execution 2. Input data into the list. 3. 3(TEST)f(ANOVA) ... Analysis of Variance (ANOVA) 4. Set calculation parameters. Specify 1 for How Many setting. 5. Align the cursor with [Execute] 1(CALC) ... Performs calculation.
examples ○ ○ ○ ○ ○ Example A psychologist is studying pattern recognition skills under four laboratory settings. In each setting, a fourth-grade child is given a pattern recognition test with ten patterns to identify. In setting A, the child is given praise for each correct answer and no comment about wrong answers. In setting B, the child is given criticism for each wrong answer and no comment about correct answers.
examples k Two-Way ANOVA Set Up 1. On the icon menu, select STAT2. Execution 2. Input data into the list. 3. 3(TEST)f(ANOVA) ... Analysis of Variance (ANOVA) 4. Set calculation parameters. Specify 2 for How Many setting. 5. Align the cursor with [Execute] 1(CALC) ... Performs calculation. 6(DRAW) ... Draws graph ○ ○ ○ ○ ○ Example The nearby table shows measurement results for a metal product produced by a heat treatment process based on two treatment levels: time (A) and temperature (B).
examples Procedure 1 m STAT2 2 bwbwbwbwcwcwcwcwe bwbwcwcwbwbwcwcwe bbdwbbgwbdjwbdcwbddwbd bwbcgwbccw 3 3(TEST) f(ANOVA) 4 2(2)c 1(LIST) bwc 1(LIST) cwc 1(LIST) dwc 1(None) c 5 1(CALC) 6(DRAW) Result Screen • Time differential (A) : Since P=0.2458019517 > 0.05 (level of significance), we can not reject the null hypothesis. • Temperature differential (B) : Since P=0.04222398836 < 0.05 (level of significance), we can reject the null hypothesis. • Interaction (A × B) : Since P=2.78169946e-3 < 0.