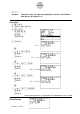
40 examples k Normal Probability Density Set Up 1. On the icon menu, select STAT2. Execution 2. 5(DIST)b(Norm)b(P.D)... Normal Probability Density 3. Set calculation parameters. 4. Align the cursor with [Execute] 1(CALC) ... Performs calculation. 6(DRAW) ... Draws graph.
41 examples ○ ○ ○ ○ ○ Example Calculate probability density p when the random variable for normal distribution N (35, 22) is 36. Procedure 1 m STAT2 2 5(DIST) b(Norm)b(P.D) 3 dgw cw dfw 1(None)c 4 1(CALC) Result Screen Result: p = 0.176 5 i 6(DRAW) (Pressing6(DRAW) draws the graph.) 6 1(P-CAL) dgw Enter the X-coordinate. The part on the graph indicates the location of the displayed coordinates (x, p).
42 examples k Normal Distribution Probability Set Up 1. On the icon menu, select STAT2. Execution 2. 5(DIST)b(Norm)c(C.D)... Normal Distribution Probability 3. Set calculation parameters. 4. Align the cursor with [Execute] 1(CALC) ... Performs calculation.
3 examples ○ ○ ○ ○ ○ Example Given that x is normal distribution with µ = –25 and σ = 4, find Pr (–21 < x < –19). Procedure 1 m STAT2 2 5(DIST)b(Norm)c(C.D) 3 -cbw -bjw ew -cfw 1(None)c 4 1(CALC) Result Screen Result: p = 0.
44 examples k Inverse Cumulative Normal Distribution Set Up 1. On the icon menu, select STAT2. Execution 2. 5(DIST)b(Norm)d(Invrse)... Inverse Cumulative Normal Distribution 3. Set calculation parameters. 4. Align the cursor with [Execute] 1(CALC) ... Performs calculation.
45 examples ○ ○ ○ ○ ○ Example Find z so that 5% of the area under the standard normal distribution curve lies to the right of z. Procedure 1 m STAT2 2 5(DIST)b(Norm)d(Invrse) 3 2(RIGHT)c .afw bw aw 1(None)c 4 1(CALC) Result Screen Result: x = 1.
46 examples k Student-t Probability Density Set Up 1. On the icon menu, select STAT2. Execution 2. 5(DIST)c(T)b(P.D)... Student-t Probability Density 3. Set calculation parameters. 4. Align the cursor with [Execute] 1(CALC) ... Performs calculation. 6 (DRAW) ... Draws graph.
47 examples ○ ○ ○ ○ ○ Example Calculate probability density p when random variable x is 1 for a tdistribution with degrees of freedom is 2. Procedure 1 m STAT2 2 5(DIST)c(T)b(P.D) 3 bw cw 1(None)c 4 1(CALC) Result Screen Result: p = 0.192 5 i 6(DRAW) (Pressing 6(DRAW) draws the graph.) 6 1(P-CAL) bw Enter the X-coordinate. The part on the graph indicates the location of the displayed coordinates (x, p).
48 examples k Student-t Distribution Probability Set Up 1. On the icon menu, select STAT2. Execution 2. 5(DIST)c(T)c(C.D)... Student-t Distribution Probability 3. Set calculation parameters. 4. Align the cursor with [Execute] 1(CALC) ... Performs calculation.
49 examples ○ ○ ○ ○ ○ Example Find point t when the right side probability is 0.05 for a t-distribution with degrees of freedom is 15. Procedure 1 m STAT2 2 5(DIST)c(T)c(C.D) 3 b.hw bEjjw bfw 1(None)c 4 1(CALC) 1.7 < t i ffffb.iw ccc 1(CALC) 1.7 < t < 1.8 i ffffb.hfw ccc 1(CALC) 1.75 < t < 1.80 i ffffb.hgw ccc 1(CALC) 1.75 < t < 1.76 i ffffb.hfdw ccc 1(CALC) • • • Result Screen Result : t =1.753 A trial-and-error process is repeated until an appropriate value is found.
50 examples k χ2 Probability Density Set Up 1. On the icon menu, select STAT2. Execution 2. 5(DIST)d(χ2)b(P.D)... χ2 Probability Density 3. Set calculation parameters. 4. Align the cursor with [Execute] 1(CALC) ... Performs calculation. 6(DRAW) ... Draws graph.
51 examples ○ ○ ○ ○ ○ Example Calculate probability density p when random variable x is 1 for a χ2distribution with degrees of freedom is 3. Procedure 1 m STAT2 2 5(DIST)d(χ2)b(P.D) 3 bw dw 1(None)c 4 1(CALC) Result Screen Result: p = 0.242 5 i 6(DRAW) (Pressing 6(DRAW) draws the graph.) 6 1(P-CAL) bw Enter the X-coordinate. The part on the graph indicates the location of the displayed coordinates (x, p).
52 examples k χ2 Distribution Probability Set Up 1. On the icon menu, select STAT2. Execution 2. 5(DIST)d(χ2)c(C.D)... χ2 Distribution Probability 3. Set calculation parameters. 4. Align the cursor with [Execute] 1(CALC) ... Performs calculation.
53 examples ○ ○ ○ ○ ○ Example Calculate the probability of a χ2 distribution when the degrees of freedom is 4 and the upper limit is χ2 = 2. Procedure 1 m STAT2 2 5(DIST)d(χ2)c(C.D) 3 aw cw ew 1(None)c 4 1(CALC) Result Screen Result : p = 0.
54 examples k F Probability Density Set Up 1. On the icon menu, select STAT2. Execution 2. 5(DIST)e(F)b(P.D)... F Probability Density 3. Set calculation parameters. 4. Align the cursor with [Execute] 1(CALC) ... Performs calculation. 6(DRAW) ... Draws graph.
55 examples ○ ○ ○ ○ ○ Example Calculate probability density p when random variable x is 1 for an Fdistribution with numerator degrees of freedem is 24 and denominator degrees of freedom is 19. Procedure 1 m STAT2 2 5(DIST)e(F)b(P.D) 3 bw cew bjw 1(None)c 4 1(CALC) Result Screen Result: p = 0.908 5 i 6(DRAW) (Pressing 6(DRAW) draws the graph.) 6 1(P-CAL) bw Enter the X-coordinate. The part on the graph indicates the location of the displayed coordinates (x, p).
56 examples k F Distribution Probability Set Up 1. On the icon menu, select STAT2. Execution 2. 5(DIST)e(F)c(C.D)... F Distribution Probability 3. Set calculation parameters. 4. Align the cursor with [Execute] 1(CALC) ... Performs calculation.
57 examples ○ ○ ○ ○ ○ Example Calculate the probability of F distribution when the lower limit is 0, the upper limit is 1.9824, n:df = 19, and d:df = 16. Procedure 1 m STAT2 2 5(DIST)e(F)c(C.D) 3 aw b.jicew bjw bgw 1(None)c 4 1(CALC) Result Screen Result : p = 0.
58 examples k Binomial Probability Set Up 1. On the icon menu, select STAT2. Execution 2. When using list data (List is selected as the Data parameter) , be sure to input data into the list first. 3. 5(DIST)f(Binmal)b(P.D)... Binomial Probability 4. Set calculation parameters. 5. Align the cursor with [Execute] 1(CALC) ... Performs calculation.
59 examples ○ ○ ○ ○ ○ Example 20 white marbles and 30 red marbles are placed into a container. One marble is taken out of and then replaced into the container, and then another marble is removed. Calculate the probability of a white marble being picked 0, 1, and 2 times. Procedure 1 m STAT2 2 5(DIST)f(Binmal)b(P.D) 3 2(VAR)c aw cw .ew 1(None)c 4 1(CALC) i cc bw ccc 1(CALC) i cc cw ccc 1(CALC) Result Screen Results: p = 0.36 when x = 0; p = 0.48 when x = 1; p = 0.
60 examples k Binomial Cumulative Density Set Up 1. On the icon menu, select STAT2. Execution 2. When using list data (List is selected as the Data parameter) , be sure to input data into the list first. 3. 5(DIST)f(Binmal)c(C.D) ... Binomial Cumulative Density 4. Set calculation parameters. 5. Align the cursor with [Execute] 1(CALC) ... Performs calculation.
61 examples ○ ○ ○ ○ ○ Example George is taking a multiple-choice examination that consists of five questions . Each question has four possible answers. George guesses at every answer. What is the probability that he can only answer three questions or less? Procedure 1 m STAT2 2 5(DIST)f(Binmal)c(C.D) 3 2(VAR)c dw fw .cfw 1(None)c 4 1(CALC) Result Screen Result : p = 0.
62 examples k Poisson Probability Set Up 1. On the icon menu, select STAT2. Execution 2. When using list data (List is selected as the Data parameter) , be sure to input data into the list first. 3. 5(DIST)g(Poissn)b(P.D) ... Poisson Probability 4. Set calculation parameters. 5. Align the cursor with [Execute] 1(CALC) ... Performs calculation.
63 examples ○ ○ ○ ○ ○ Example The probability of scratches occurring in the wire during a certain wire drawing process is 0.1 per meter. This means that you can expect 1.5 scratches for every 15 meters of wire. Calculate the possibilities of 0, 1, and 2 scratches occurring. Procedure 1 m STAT2 2 aw bw cw 3 5(DIST)g(Poissn)b(P.D) 4 1(LIST)c 1(LIST)bwc b.fw 1(None)c 5 1(CALC) Result Screen Result: µ=0 µ=1 µ=2 p = 0.223 p = 0.335 p = 0.
64 examples k Poisson Cumulative Density Set Up 1. On the icon menu, select STAT2. Execution 2. When using list data (List is selected as the Data parameter) , be sure to input data into the list first. 3. 5(DIST)g(Poissn)c(C.D) ... Poisson Cumulative Density 4. Set calculation parameters. 5. Align the cursor with [Execute] 1(CALC) ... Performs calculation.
65 examples ○ ○ ○ ○ ○ Example The average number of trucks arriving on any one day at a truck depot in a certain city is known to be 12. What is a probability that on a given day fewer than 9 trucks will arrive at this depot? Procedure 1 m STAT2 2 5(DIST)g(Poissn)c(C.D) 3 2(VAR)c iw bcw 1(None)c 4 1(CALC) Result Screen Result : p = 0.
66 examples k Geometric Probability Set Up 1. On the icon menu, select STAT2. Execution 2. When using list data (List is selected as the Data parameter) , be sure to input data into the list first. 3. 5(DIST)h(Geo)b(P.D) ... Geometric Probability 4. Set calculation parameters. 5. Align the cursor with [Execute] 1(CALC) ... Performs calculation.
67 examples ○ ○ ○ ○ ○ Example If the probability is 75% that an applicant for a driver's licence will pass the road test on any given try. What is the probability that an applicant will finally pass the test on the 4th try? Procedure 1 m STAT2 2 5(DIST)h(Geo)b(P.D) 3 2(VAR)c ew .hfw 1(None)c 4 1(CALC) Result Screen Result : p = 0.
68 examples k Geometric Cumulative Density Set Up 1. On the icon menu, select STAT2. Execution 2. When using list data (List is selected as the Data parameter) , be sure to input data into the list first. 3. 5(DIST)h(Geo)c(C.D) ... Geometric Cumulative Density 4. Set calculation parameters. 5. Align the cursor with [Execute] 1(CALC) ... Performs calculation.
69 examples ○ ○ ○ ○ ○ Example Calculate the geometric cumulative probability for x = 2, 3, 4 when p = 0.5. Procedure 1 m STAT2 2 5(DIST)h(Geo)c(C.D) 3 2(VAR)c cw .fw 1(None)c 4 1(CALC) i fff dw cc 1(CALC) i fff ew cc 1(CALC) Result Screen Results: p = 0.75 when x = 2; p = 0.875 when x = 3; p = 0.