
User Manual

20090601
S
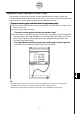
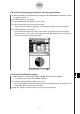
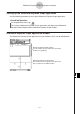
To change a line in a clustered line graph to a column graph
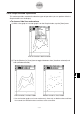
(1) Draw the clustered line graph.
(2) With the stylus, tap any data point on the line you wish to change to a column graph.
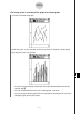
(3) On the [
Calc] menu, tap [Column].
• You could also tap the down arrow button next to the third tool button from the left,
and then tap
&
.
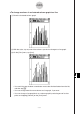
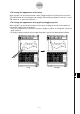
• You can change more than one line to a column graph, if you want.
• You can change a column graph back to a line graph by selecting one of its columns
and tapping [Line] on the [Calc] menu.
13-9-17
Graphing