
User Manual


42
iLM8 – Live User Manual
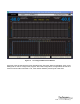
5 The log file data is now displayed in Excel. Each column header contains the text description of
the data that is displayed.
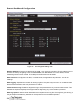
6 In order to make a line graph, first select the data that will be displayed in the graph. Hold down
the control key and click on the column headers that contain the desired data. To only select a
small portion of data from the log file, click the first value, hold the shift key, and then click on
the last value.
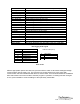
7 In Excel 2007, click on the Insert tab. Click the Line button and then select Line under the 2-D
Line group. In Excel 2000 or 2003, click on the Insert menu, and then click on Chart. The Chart
Wizard will appear. Select Line from the list on the left side of the window and then Line from
the icons on the right side of the window. Click the Finish button.
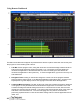
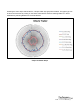
8. The Chart is created. It may be moved to another area of the spreadsheet or copied to memory
and pasted in another application. The X axis (left edge of the graph) displays the loudness
value and the Y axis (top edge of the graph) displays the sample number, in this example.