
White Papers

Internal Use - Confidential
Copyright © 2019 Dell Inc. or its subsidiaries. All Rights Reserved. Dell, EMC and other trademarks are trademarks of Dell Inc. or its subsidiaries
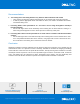
Every benchmark ran on single node PowerEdge servers, as seen in Figure 2. Each server was loaded with
either 2, 3, 4 or 8 Tesla V100 PCIe GPU’s, and these configurations ran until the unique domain being tested
reached the target accuracy. By comparing these configurations, we can deduce the performance increase
per domain when additional GPU’s are included.
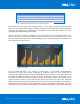
MLPerf scores were calculated by exhibiting the total training times of each configuration relative to the
reference accelerator, one NVIDIA Pascal P100. Each score indicates that the Tesla GV/V100 server is that
many times faster than the Pascal P100. This methodology ensure consistency amongst each platform so that
each scaled score remains accurate.
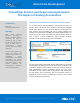
The first notable observation is the variance in training times for each domain. Recommendation,
Reinforcement Learning and Language Translation DL consistently require the most training time for
completion, while Object Detection and Image Classification appear to take half as long. This illustrates the
varying learning difficulties associated with each DL domain. Furthermore, we learn from observing Figure 3
that Image Recognition (Resnet50) and Object Detection (Mask-RCNN) domains scale linearly; we can
assume that when the GPU count increases than the speedup times decrease at a linear rate. Translation
(NMT) and Recommendation (NCF) domains, on the other hand, were not as predictable. The bar graphs for
Translation scores almost seems to scale quadratically and the Recommendation scores appear to not scale
beyond 2 GPU’s (it is an artifact of the dataset being too small which is being fixed in a later version of MLPerf).
Server
# of CPU's
# of GPU's
GPU Type
GPU Interconnect
DSS 8440
2
8
V100 (16GB)
PCIe
PE T640
2
4
V100 (32GB)
PCIe
PE R740
2
3
V100 (16GB)
PCIe
Precision 5820
1
2
GV100 (32GB)
PCIe
Figure 3: MLPerf benchmark scores calculated against the reference accelerator (one
NVIDIA Pascal P100)
Figure 2: PowerEdge CPU & GPU details for each tested configuration