
White Papers

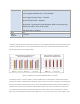

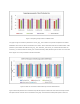


Figure 4: Comparing snoop modes for ANSYS Fluent
The graph in Figure 4 shows the performance of truck_poly_14m for all the snoop modes compared to the default
OSB.DAPC which is shown as the red baseline in the graphs. All the other benchmarks show a similar pattern. COD
performs up to 2% better than OSB for truck_poly_14m, combustor_12m and ice_2m. COD is about 5% better for
combustor_71m and 6% better for exhaust_33m. COD is followed by OSB, followed by ES for lower core counts and
HS for higher core count processors for all the benchmarks.
Figure 5: DAPC vs. Performance with COD snoop mode for ANSYS Fluent
Figure 5 shows the performance for Performance profile with respect to DAPC with COD set as the snoop mode for
both options. DAPC is shown as the red baseline in the graph. The Performance BIOS profile option is about 4%