
White Papers
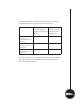

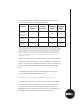

The maximum backup throughput achieved for each of the three
system congurations is summarized as follows:
Backup
Solution
Number of
Backup client
systems
Number of
MD1000
Enclosures
Exchange
Throughput
3
GB/hr
SQL
Throughput
3
GB/hr
DL2000
Performance
Optimized with 6
GbE ports
24 5 1833 2645
DL2000 Value
Series with 6
GbE ports
12
1
2 1577 2218
DL2000 Value
Series with 2
GbE ports
2
12 2 991 1403
As seen in the table above, backup throughput rates for the DL2000
Performance Optimized version with six (6) GbE ports were found to
be up to 17% faster than DL2000 Value Series with six (6) GbE ports
and up to 47% faster than DL2000 Value Series with two (2) GbE
ports.
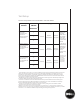
The following discussion analyzes the data gathered during the
benchmark from three different perspectives.
Analysis by the Number of MD1000 Enclosures:
In general, going from one to two enclosures provided a signicant
increase in throughput. Beyond two enclosures the benets were
minimal. With the Value Series hardware, going beyond two (2)
MD1000 enclosures resulted in a small decrease in throughput in a
few cases since the processor became the limiting factor.
1
Adding clients beyond 12 reduced throughput due to processor limitations on the DL2000 Value Series.
2
For DL2000 Value Series with two (2) GbE ports, throughput was limited by the two (2) GbE ports. Increasing
the number of MD1000 enclosures and backup client systems had little to no effect on the backup throughput.
3
Throughput was measured at each of the NIC ports of the DL2000 during a 10 minute interval of ingest.
Values were adjusted by 4.3% to account for the Ethernet frame preamble, Ethernet header and TCP/IP
Packet header overhead. Compression ratios were factored, where applicable in the aggregate throughput
measurements to arrive at end-to-end effective throughput. Software compression ratios were 1.2 for
Exchange and 1.7 for SQL.