
White Papers


42 BP1062 | Best Practices for Decision Support Systems with Microsoft SQL Server 2012 using Dell EqualLogic PS Series
Storage Arrays
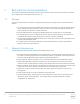
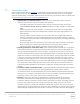
SAN Scalability Figure 21
Figure 21 Illustrates that the average read throughput scaled proportionally with the addition of more
arrays. The query execution times increased by 6% in the two array scaling tests due to the increase in
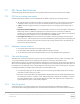
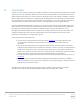
user load. The average and maximum CPU utilization percentages were measured using Perfmon. As
shown in Figure 22, the average and the maximum CPU utilizations observed in the scalability test were
well below 80%. In the two array scaling tests, the average and maximum CPU utilizations were similar to
the one array scaling tests. This was a result of the second Dell PowerEdge R820 server which provided
the additional CPU processing power.
SAN scalability – CPU utilization Figure 22
895
1700
433
462
410
420
430
440
450
460
470
0
200
400
600
800
1000
1200
1400
1600
1800
1xarray 2xarrays
Time (minute)
Throughput (MB/sec)
SAN scalability
Average Read throughput
Query Completion time
15
14
46
47
0
5
10
15
20
25
30
35
40
45
50
1xarray 2xarrays
% CPU Utilization
SAN scalability- CPU utilization
Average CPU Utilization
Max CPU utilization