
Instruction manual


Copyright © 2007, 2008 Eagle Tree Systems, LLC
http://www.eagletreesystems.com
Page
2
Just plug the Interface cable in based on the polarization of the JR plug. NOTE: with a standard servo Y cable, you can connect your
Spektrum™ Flight Log™ LCD data display at the same time as the Eagle Tree Interface cable.
Connecting the Interface to your Data
Recorder
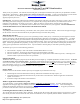
The 4 pin plug of the Interface cable plugs into the
“GPS” port of your Data Recorder, as shown in Figure
1. Note the correct polarity of the Interface cable
plug, as shown in Figure 1.
Connecting the Interface to the eLogger V3
The 4 pin plug of the Interface cable plugs into the
“GPS” port of your eLogger V3, as shown in Figure 2.
Note the correct polarity of the Interface cable plug, as
shown in Figure 2.
Configuring the Interface with the Windows
Application
If you have not already done so, set up the Recorder
software as described in your instruction manual.
Then, click connect your Recorder or eLogger V3 to
the PC with the USB cable, and choose “Tools,
Enable Spektrum™ Flight Log Interface.” Then,
click the “Enable Spektrum™ Interface” checkbox, and click OK.
Logging Interface Data
To log interface data, just click “Tools, Choose Parameters to Log in the
Recorder” and check the “Spektrum™ AR9000™ Flight Log Interface”
checkbox.
Displaying Interface Data the Windows Application
Once the Interface is enabled in software as described above, whenever
data are downloaded from the recorder and played back, or when PC Live
Mode is started, Interface data will be displayed at the bottom of the
Windows Application screen. The format of the interface data is as
follows:
Spektrum: Holds=0, Lost Frames=0, Ant Fade A=0,
Ant Fade B=0, Ant Fade Left=0, Ant Fade Right=***
Note that when “***” is displayed for a particular antenna, this indicates
that the antenna is either not attached or not functioning properly.
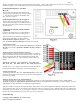
Graphing Interface Data
To graph logged Interface data, click “Graph Data/2D Chart,” select either
the Left Y Axis or Right Y Axis, and select one or more of the Spektrum™
parameters for graphing.
Displaying Interface Data on the Seagull Dashboard
To configure the Interface to display Receiver performance parameters on your Seagull Wireless Dashboard, select “Tools, Choose
Parameters to Display on Seagull Wireless Dashboard LCD” and just choose the Spektrum™ parameter(s) you wish to display. See your
Seagull manual for more information on configuring Seagull parameters.
Note that in addition to being able to program an audible “High Alarm” with each of the Spektrum™ parameters and specifying how many
errors triggers the alarm, you can also check the “Reset the alarm count every one minute” option. With this option, the error count for that
parameter is reset every minute. If you are flying for a long time, or in an environment with lots of RF noise, this may be desirable to keep
the alarm from going off unless you get a lot of receiver errors in a short time.
Troubleshooting