
Application Note


5 Fluke Corporation Using a Fluke ScopeMeter 125 to Troubleshoot FOUNDATION™ Fieldbus Installations
lengths, those data should be
kept at hand as an aid during
fault finding. Any deviation from
the as-builts is a first indication
of the quality of the cable instal-
lation and connections and may
help lead troubleshooters to the
location of a faulty connection.
Since current (load) fluctuations
are inevitable, when selecting a
power supply and voltage level,
system designers should take as
a basis the full-load output volt-
age of the power supply, while
accounting for any voltage drop
in the power conditioner.
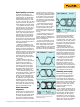
Signal levels
Signal level is measured as the
peak-to-peak amplitude of the
ac-waveform. It is directly related
to the impedance of the network
trunk, and any deviation from the
nominal impedance will impact
signal levels.
A common cause of improper
impedance is the use of too few
or too many network terminators.
More or less than two termina-
tors per trunk section will result
in incorrect signal amplitude due
to impedance as well as reflec-
tions and distortions.
A third terminator will cause
signal attenuation of about 3 dB
(-30 %). A missing or broken ter-
minator will result in an increase
in amplitude above nominal by
as much as 60 %.
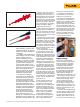
Long stretches of cable also
attenuate signals. Commonly
used cable in H1 Fieldbus sys-
tems attenuate signals by about
0.3 dB per 100m or 5.7 dB over
the full length of a 1900m trunk.
The 5.7 db value means that
for every volt of signal injected
at one end of the cable, one
should expect to see no more
than 520 mV at the other end of
the cable.
The nominal output signal
amplitude at any device is
800 mVpp to 900 mVpp. (where
“pp” stands for “peak-to-peak”).
At a distance along the network,
the amplitude may be as much
as 50 % lower without any risk
of error.
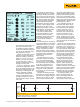
The Fluke 125 can be config-
ured to measure peak-to-peak
amplitude or to measure the low-
level or high-level excursions of
the signal compared specifically
to the bias voltage. Just as with
the dc-voltage measurements
described earlier, the Fluke 125
compares the actual reading to
pre-set limits and presents on
its screen, along with the actual
reading, clear indications of good
or bad readings.
The most common measure-
ment is peak-to-peak amplitude.
See Figure 7. A user of the
instrument is free to compare
readings to built-in default levels
or to enter alternative, user-
defined levels instead. When a
limit is set to a value other than
a default value, the text displays
an asterisk (*), as seen on the
“Vbias” line in Figure 7.
In troubleshooting, check the
signal levels at various points
along the network to deter-
mine if the values make sense.
Look for patterns in amplitude
differences. For example, sud-
den differences at either side
of a junction box is a “red flag”
suggesting the presence of a
hardware fault.
If any particular device
appears to be causing difficul-
ties, measure on all sides of the
junction box: incoming trunk,
outgoing trunk, and spur. There
should be no differences in sig-
nal level or supply voltage here.
In addition, take a reading at
the device end of the spur, and
compare this reading to those
recorded at the junction box.
In transmitting mode, a device
should generate a signal in the
800 mVpp to 900 mVpp range.
Signals above 1000 mVpp indi-
cate incorrect trunk-section
termination.
Ordinarily, depending on
the distance to the transmitter,
signals in the 250 mV to 950 mV
range are acceptable. Levels
below 250 mVpp are likely
to cause errors in Fieldbus
devices and need to be investi-
gated further.
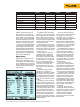
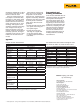
Device 1 Device 2 Device 3 Device 4
Distance from supply 100m 500m 1000m 1900m
Length of section (single conductor) 100m 400m 500m 900m
Resistance of section
4.52 Ω 18 Ω 22.6 Ω 40.7 Ω
Total copper resistance
4.52 Ω 22.6 Ω 45.2 Ω 85.88 Ω
Device current 25 mA 25 mA 25 mA 25 mA
Total current 100 mA 75 mA 50 mA 25 mA
Voltage drop in section 0.45 V 1.36 V 1.13 V 1.02 V
Total voltage drop 0.45 V 1.81 V 2.94 V 3.96 V
Table 1: Supply voltage calculations for the network in Figure 6.
Figure 7: Set-up screen for changing test-limit values.