
Application Note


7 Fluke Corporation Using a Fluke ScopeMeter 125 to Troubleshoot FOUNDATION™ Fieldbus Installations
munication problems do not have
to be close to each other for the
former to affect the latter.
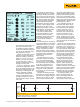
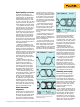
Figure 9, another screen cap-
ture, depicts a somewhat noisy
bus signal. In such cases, check
the noise level at the middle or
baseline level on the left of the
screen (just below the “A” trace
marking). This segment of the
waveform represents the steady-
state voltage on the bus just
before the capture of any data
packets. Since the line should be
relatively quiet here, the signal
amplitude at this point is a good
indicator of the noise level on
the bus.
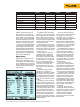
Appendix
Example of Cable Characteristics
Characteristics of Fieldbus H1 Cable
General Characteristics
Standard IEC61158 Part 2
Conductor stranded plain copper
Conductor size
(multi-wire)
AWG18 AWG16 AWG14
Conductor thickness
(approx.)
1 mm 1.3 mm 1.6 mm
Conductor diameter 0.8 mm
2
ca. 1.3 mm
2
2.1 mm
2
Color coding positive conductor = orange; negative conductor = blue.
Screen aluminum tape in contact with continuous copper wire,
covered with wire braid
Overall diameter 7.9 mm
(0.311 in)
9.5 mm
(0.374 in)
11.5 mm
(0.453 in)
Weight 85 g/m 110 g/m 160 g/m
Electrical characteristics
Conductor resistance
(per conductor)
21.8 Ω/km 13.7 Ω/km 8.6 Ω/km
Screen resistance
9 Ω/km 6 Ω/km 6 Ω/km
Attenuation at 39 kHz 3 dB/km 2.7 dB/km 2.7 dB/km
Inductance 0.65 mH/km
Mutual capacitance 60 nF/km
Capacitance
unbalance to earth
max. 2 nF/km
Characteristic
impedance
100 ±20 Ω
Test voltage
(core-to-core and
core-to-screen)
1500 V
Operating voltage max. 300 V
Table 2: Characteristics of three typical Fieldbus H1 Trunk cables.
Since there is no clear limit
value that can be specified as
acceptable or as the certain
source of error, evaluating noise
signals is necessarily somewhat
subjective. Still, heavy bus noise
is a likely cause of communi-
cation errors. Here are some
guidelines:
•
A noise level less than 50 mVpp
on a signal of 800 mVpp is a
near-perfect signal.
•
A noise level more than
100 mVpp on a signal level
of only 500 mVpp is likely
to cause frequent communica-
tions faults.
Data analysis and
drawing conclusions
Once the tests described here are
completed, bringing the collected
data together and analyzing
the results should allow one to
draw conclusions about what is
happening on the network and
where the weak spots likely are.
Sometimes, analyzing the avail-
able data will raise additional
questions, which can then be
the basis for additional tests,
bringing investigators closer to
finding solutions to troubling
network flaws.
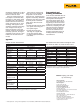
Fieldbus H1
Min Max
Vbias 5.5 35.0
V(high – bias) 0.375 0.500
V(bias – low) 0.375 0.500
Vpp 0.75 1.00
Rate 31.1 µs 32.9 µs
Bit width 32 µs nom.
Rise Time N.A. 200 ns
Fall Time N.A. 200 ns
Jitter N.A. 0.1 %
Overshoot N.A. 10.0 %
Bus-health limits used as default settings for Field-
bus within the Fluke 125, based on IEC61158-2.
“FOUNDATION Fieldbus” is a trademark of the Fieldbus Foundation.
All trademarks are the property of their rightful owners.
Fluke Corporation
PO Box 9090, Everett, WA USA 98206
Fluke Europe B.V.
PO Box 1186, 5602 BD
Eindhoven, The Netherlands
For more information call:
In the U.S.A. (800) 443-5853 or
Fax (425) 446-5116
In Europe/M-East/Africa +31 (0) 40 2675 200 or
Fax +31 (0) 40 2675 222
In Canada (800)-36-FLUKE or
Fax (905) 890-6866
From other countries +1 (425) 446-5500 or
Fax +1 (425) 446-5116
Web access: http://www.fluke.com
©2008 Fluke Corporation. Specifications subject
to change without notice. Printed in U.S.A.
1/2008 3214669 A-EN-N Rev A
Fluke. Keeping your world
up and running.
®