
Application Note


3 Fluke Corporation Basic power quality measurements on the go with the Fluke 345
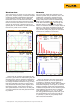
The waveform in Figure 3 would only exist in
a perfect world, without harmonics. Since that’s
unlikely to exist it’s more often that something
similar to the the distorted waveform in Figure 4
will be present.
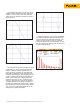
Using the Fluke 345, you can view waveforms,
and, more importantly, distortion measurements
and even the level of individual harmonics. The
screen in Figure 6 shows a view of individual
harmonics. Armed with this information, you can
develop a strategy for dealing with the harmonics
in your electrical system.
Figure 3. Clean sine wave.
Figure 4. “Real world” distorted sine wave.
Figure 5. Current for an electronic load.
Figure 6. Current harmonics bar graph.
The distorted voltage shown in Figure 4 is still
recognizable as a sine wave and contains only
about 4 % THD. So, voltage typically isn’t the
source of today’s problems. It’s more likely that
there will be significant current distortion and a
relatively clean voltage. In fact, it’s likely that the
current waveform will be like the one shown in
Figure 5. This comes from a single-phase load.
Distortion factor here is 76 %. If this load were
drawing a large amount of current this could be
a problem, because it may cause overheating of
neutrals and transformers in the system. If there is
large current draw with significant current distor-
tion, it may even cause added distortion on the
voltage due to system impedances.