
Data Acquisition System/Data Logging System Getting Started Guide


Getting Started
Managing Your Network Using Fluke DAQ
57
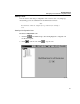
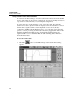
The dialog box entries include:
Pen
Click to select the device, module, or channel that you want to view in
the chart. You can view up to 8 items on the chart.
Type
Specify On Line or History scan view. History view shows the last set of data
displayed with the pens.
Zoom
Use
to expand or compress the time interval you are viewing.
Use
to increase or lower the amplitude resolution
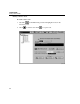
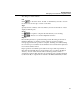
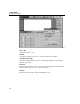
Export
Press the Export button to generate the Export CSV file dialog shown below.
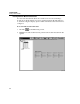
Click the OK button to start the conversion. The "Conversion complete"
message appear when the operation is complete. Scanning can continue during
the conversion process but the rate at which the new scan data can be uploaded
from a device will be slowed.
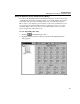
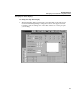
Export generates several files per module for an export. The export function
takes files from the Hst directory and generates new "csv" files in the Export
directory. You can select the base name of the files generated. A file is
generated for each module. Two files are generated for the computed channels
(1-30 and 31-60). A separate file is created for the DIO/totalizer/relay module.