
Microcontrollers Debugger Manual


ColdFire V1 Full Chip Simulation Connection
FCS Visualization Utilities
593
Microcontrollers Debugger Manual
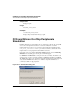
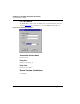
You can see the current mode of Simulation (SAMPLE, CORE or MCU derivative) in the
status bar. You can access the Set Derivative dialog box by double clicking on the FCS
support entry in the status bar. See Debugger Status Bar with Full Chip Simulation.
FCS Visualization Utilities
The debugger component family includes utility components that extend to the production
phase of applications, such as the host application builder components and process
visualization components.
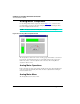
These components contain visualization utilities that graphically display such things as
values, registers, and memory cells, or provide an advanced graphical user interface to the
simulated I/O devices, and program variables.
This section describes the components of the visualization utilities that belong to the
standard Debugger installation.
WARNING! The following visualization components can only be used with the Full
Chip Simulation connection.