
User's Manual


Working with Charts
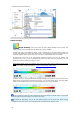
Navionics : MapMedia mm3d "Datacore by Navionics" vector charts format
When a Vector Chart is selected (either "HOs S-57", "Jeppesen" or "Navionics"), the "S-52 Display"
allows you to choose from Various Preset display configurations (Base, Standard, Fishing, Others). When
set to "Custom", use the "S-52 Display" Menu to customize the configuration.
Refer to the chapter Adjusting Vector Charts Display for more information
.
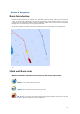
Raster Charts :
Raster : click on this button to display Raster Charts from hydrographic Offices (NOAA,
SHOM, UKHO,...).
Fishing Charts :
Fishing Charts: click on this button to display Fishing Charts.
Note that the Fishing Charts Button is hidden by default. Click on the Configure button to add it to the
Work Space configuration. The Fishing chart button will be grey out if fishing chart has not been installed.
When the "Chart Boundaries" option is selected from the Plotter Display menu, Purple boundaries
outlines are displayed where chart detail is available.
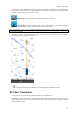
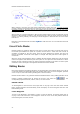
Satellite Photos:
Sat Photo : click on this button to overlay Satellite pictures over the Charts.
Satellite pictures can now be fused with raster or vector charts by a method called PhotoFusion.
Land areas are completely opaque, so that these areas are displayed as high-resolution satellite
photos on the chart. As the depth increases, the satellite photography becomes more transparent so
that the shallows are displayed along with the chart information. As the deeper water begins, the
photograph disappears leaving the raster or vector chart.
High-resolution satellite photography aids in seabed classification enabling easier identification of
sand, rock, coral or other obstructions.
Note: PhotoFusion is only displayed where 3D Bathymetry data is available. If no 3D data is available for a
particular area, the Satellite pictures can be manually adjusted from the Plotter Display Options menu.
When the "Chart Boundaries" option is selected from the Plotter Display menu, Green boundaries
outlines are displayed where Satellite picture is available
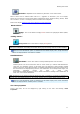
The chart properties
Source, issue date, etc…can be displayed by right clicking on the chart and selecting “Chart
Properties”:
17