
User's Manual


Working with Charts
19
Geographic Grid:
Select Grid: click on this button to display the geographical grid on chart.
Adjusting Vector Charts Display
Unlike Raster charts, Vector charts can provide control over the level of displayed information. Vector
charts are made up of individual objects and data layers such as navigations aids, spot soundings and
land features that can be displayed or hidden. These adjustments are made from the
Vector Chart
and
S-52 Display Option menu.
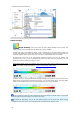
Vector Chart Menu:
"Chart object Size" is a slider that allows the user to change the size of the vector Charts
depth Sounding and Objects (Buoys, Wrecks, Obstructions, etc...)
"Chart Color Palette" allows the user to change the colors (or "theme") of the Charts.
"Chart Symbol" allows the user to change the buoys icons to either the "S52" or
"International" representation.
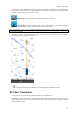
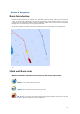
The Shallow/Safety/Deep Contour parameters are used to color the various depth area of
the Vector Chart. The transition between colors are based upon the depth contour lines of the
vector chart. If no contour line (corresponding to the exact value you selected) is available on
the vector charts, the color transition will happen at the next (deeper) contour line available.
In addition to these screen rendering parameters, the Vector Chart Menu allows you to turn ON
or OFF the display of specific object (such as Buoys Name or Light Description).
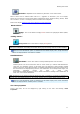
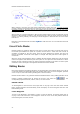
S-52 Display Menu:
This menu allows fine tuning of the vector charts objects that are displayed on the screen.
The S52 Vector Chart Display Mode provides quick access to five different levels of detail for
vector charts :
"base" shows the minimum set of objects necessary for planning.
"standard" adds other objects that are necessary for safe navigation
"Other"
"Fishing"
"Custom" uses the settings defined under the S-52 Custom menu (checked boxes)
Note: The "Base", "Standard", "Other" and "Fishing" preset are based upon the official S52 rules