
User's Manual


Marks & Objects
51
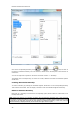
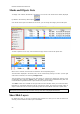
Click on the Ribbon layers to show or hide all together actual selected layer and right-click on
it to select which layer you want to show or hide:
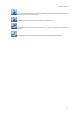
Click Marks to show or hide all marks that have been added on chart
Click Boundaries to show or hide all boundries (circle, lines or polygons) that have been
plotted on the chart
Click Annotations to show or hide all annotations that have been typed on the chart