
Operation Manual


DATA MANAGER - GET DATA ACQUISITION SOFTWARE rev. 01
2013 - GET by Athena - All rights reserved
ENGLISH
10
TAB 2: SUSPENSION
CHANNELS
TAB 3: SPEED AND
ACCELERATION
CHANNELS
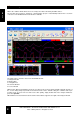
If an individual lap is being analysed, each channel is represented with a different colour graph. If this is not
the case, and several laps are being analysed at the same time, the graphs are represented with the colours
of the corresponding laps.
The analysis window is also composed of the following elements:
• Y axis: this shows the scale and the name of each channel displayed, using the same colour as the
graph.
• X axis: this shows the scale of the time or the distances (according to the settings).
• Lap bar: this is composed of numbered rectangles, indicating the number of laps available, relative to the
selected sessions. The coloured rectangles indicate the part of the session displayed in the analysis
window. Each lap added to the analysis window has a rectangle of the same colour on the lap bar.
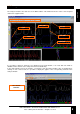
• Linear map (can be viewed at the bottom of the analysis window, under the x scale): if segments have
been associated with the course of the selected session, the linear map displays the sequence of the
segments relative to the area displayed in the analysis window. Each segment is displayed with the
corresponding colour and name. The linear map can be activated/deactivated using the “M” button or
from the analysis window context menu.
• Finish lines: these are represented with white numbered vertical lines and are only displayed if they have
been inserted in the course in use.
• Split times: these are represented by white vertical broken lines. They are only displayed if the course in
use contains split points and only if they have been enabled in the program options window.