
Submittal Sheet
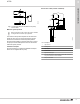
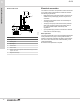


Table Of Contents

5. Performance curves
How to read the curve charts
0 2 4 6 8 10 12 14 16 18 20 22 24
Q [US GPM]
0
20
40
60
80
100
120
140
160
180
[ft]
H
0.0 0.5 1.0 1.5 2.0 2.5 3.0 3.5 4.0 4.5 Q [m³/h]
0
5
10
15
20
25
30
35
40
45
50
55
[m]
H
JP PS 22 10 157
60 Hz
ISO 9906:2012 3B
1
2
4
3
TM074024
Pos. Description
1 Pump type and frequency
2
Q-H curve for the pump; head (ft/m) to flow rate (gpm/m
3
/h)
3 [H] Head (ft/m)
4
[Q] flow rate (gpm/ m
3
/h)
The guidelines below apply to the following curves:
1. Standard motors are used for the measurements.
2. Measurements have been made with airless water at a
temperature of 68 °F (20 °C).
3. The curves apply to a kinematic viscosity of Ʋ = 1
mm
2
/s (1 cSt).
4. The QH curves apply to actual speed with the motor
types mentioned at 60 Hz.
Related information
Selection table
JP PS
5
12
Performance curves