
Datasheet

MDO-2000E series is multi-functional mixed domain oscilloscope. The series includes two feature combinations : MDO-2000EG and
MDO-2000EX. MDO-2000EG models have a built-in spectrum analyzer and a dual channel 25MHz arbitrary waveform generator and
MDO-2000EX models feature a built-in a spectrum analyzer, arbitrary waveform generator, a 5,000 count DMM, and a 5V/1A power
supply. The first of its kind, MDO-2000EX is the only oscilloscope to equip with a DMM and a power supply in the T&M industry.
One Oscilloscope ,Two Domains
Compared with the general spectrum analyzer, the spectrum function of MDO-2000E series can test below~9kHz signals, which is
applicable to the frequency domain analysis of audio frequency and vibration. MDO-2000E series can also test the frequency domain
signal with DC component without damaging the instrument. With respect to frequency domain waveform display, MDO-2000E series,
featuring the same capability of a real-time spectrum analyzer, is faster than the general spectrum analyzer. Why? It is because MDO-
2000E series utilizes digital circuit and software to calculate FFT. The general spectrum analyzer can only process the signal of a narrow
frequency bandwidth at a time by frequency sweeping. Each sweeping will take several ms to dozens of ms. Hundreds and thousands of
frequency sweepings are gathered to form a spectrum. Therefore, the displayed spectrum is not obtained at the same time. MDO-2000E
series obtains spectrum display at the same time by utilizing digital circuit and software to calculate FFT that is faster than the frequency
sweeping method. The FFT settings of oscilloscopes are based upon horizontal scale (sample rate) setting, which is totally different from
the frequency range setting of MDO-2000E series. Most instruments will have insufficient frequency resolution due to insufficient FFT
points while conducting spectrum measurement by FFT. Compared with the FFT of oscilloscopes, MDO-2000E series satisfies users with
signal measurement requirements under 9kHz; a better setting interface, measurement resolution and measurements speed.
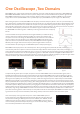
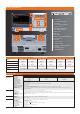
MDO-2000E series frequency domain also includes Spectrum Trace Type settings (Normal, Max-hold, Min-hold, and Average) .
(Figure 1)
Users can freely select various Spectrum Traces for simultaneous display. Detection method (Sample, +Peak, -Peak, and Average)(Figure 2)
can be individually set for each Trace. Additionally, users, via Cursor, can manually mark the corresponding positions to reflect Frequency
and Amplitude. The Search function can also be applied to log spectrum's Peak Table. Amplitude is displayed with dB and Marker can
obtain measurement data. Users can use the Search function to search and mark the amplitude and frequency of spectrum signal. Search
methods include Max. peak and threshold. Measurement results can be displayed and saved.
(Figure 3)
While entering the spectrum mode, MDO-2000E series will display a full screen of frequency domain. Users can input Center frequency,
Span, Start frequency, and Stop frequency based upon test requirements so as to rapidly and intuitively observe required frequency range
that allows users to experience the user interface of a real spectrum analyzer. While observing frequency domain display, engineers can
observe waveform characteristics, which are not easily to be seen from time domain waveforms, for instance, the harmonic composition
of a waveform and the frequency characteristics of a modulation signal. Compared with oscilloscope'
FFT, MDO-2000E series allows engineers to effectively conduct signal measurements on frequency
domain.
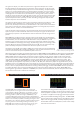
Conventional DSO's FFT always calculates the entire signal bandwidth up to half the sampling
rate (Fs). However, the insufficient calculation capability can't conduct FFT calculation with
more points. Users can't have the signal's detailed frequency information due to the insufficient
frequency resolution from the calculation result. Whereas MDO-2000E series analyzes signal
spectrum of interest. Compared with oscilloscope' FFT, MDO-2000E series allows engineers to
effectively conduct signal measurements on frequency domain. Right illustration shown the
conventional DSO's FFT (above figure) VS. MDO-2000E's Spectrum analyzer (below figure).
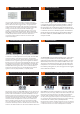
Three screen displays on the right show the spectrum results of MDO-2000E's spectrum
analyzer and the FFT of two different branded oscilloscopes after testing the same FSK signal.
The parameters of FSK signal: 500mVpp sine wave, fmax: 10.2MHz, fmin: 10.0MHz, bit rate:
10.0kHz.The upper right screen display is the spectrum of MDO-2000E's spectrum analyzer.
Users can directly input Center and Span Frequency by an intuitive and swift setting. Fmax and
fmin can be clearly identified from the screen display.
Figure 1 Figure 2 Figure 3