
Datasheet

B.
SUPPORT I C ,SPI ,UART,CAN, LIN BUS TRIGGER AND DECODING FUNCTIONS
The serial bus technology has been widely applied in the present
embedded application design. The IoT devices connecting sensors
and the peripheral components are using serial bus such as UART,
I C, and SPI. To rapidly and correctly trigger and analyze serial bus
2
data has posed a difficult challenge to engineers. The MDO-2000E
series provides serial bus analysis function with 10M long memory
depth. Users can trigger, decode, and analyze frequently used I C,
2
SPI and UART serial bus and CAN/LIN bus, which is often used by
automotive communications.
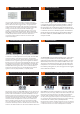
The MDO-2000E series oscilloscope allows users to easily and
completely observe inrush signals and rare transient waveforms to
increase waveform debugging efficiency by using features, including
advanced VPO (Visual Persistence Oscilloscope) signal processing
technology, waveform update rate as high as 120,000 wfm/s, and
multi-layered afterglow display to enhance waveform display efficiency.
Oscilloscope with VPO technology displays signals with three dimensional
waveforms constructed by amplitude, time and signal strength to show
each waveform point. 256 color gradients yield clear waveform changes.
Comparing with the conventional digital storage oscilloscope, the
MDO-2000E series provides more natural and more genuine signal
display effect which is very close to the original analog signal.
A.
120,000wfm/s WAVEFORM UPDATE RATE AND VPO WAVEFORM DISPLAY TECHNOLOGY
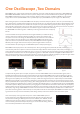
FRA of RC high-pass filter
Cursor measurement for the determination
at 3dB cut-off frequency of the high-pass filter.
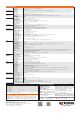
Other than the new functionalities, the hardware characteristics of MDO-2000EG and MDO-2000EX are identical to those of GDS-2000E
Series. MDO-2000EG and MDO-2000EX are equipped with 8-inch display and feature bandwidth selections of 200MHz, 100MHz, and
70MHz. Models with two analog channels provide 1GSa/s real-time sampling rate per channel; models with four analog channels
provide 1GSa/s maximum real-time sampling rate. The waveform update rate of 120,000 wfm/s and the minimum 1mV/div vertical
range allow MDO-2000EG series MDO-2000EX to measure complex feeble signals and clearly display measurement results. With
respect to the memory depth, MDO-2000E series provide 10M long memory for users to completely retrieve and analyze waveforms.
Users, based upon the application requirements, can select 1k, 10k, 100k, 1M or 10M memory depth. The segmented memory can be
divided the maximum into 29,000 sections for users to bypass any unimportant waveforms so as to swiftly search all required waveforms.
With the function, more meaningful waveforms can be saved and target waveforms can be displayed rapidly. With the waveform search
function, users can rapidly search desired waveforms according to the required trigger conditions. MDO-2000E series also provides 1M
FFT display that allows users to correctly and efficiently acquire measurement results of the frequency domain. MDO-2000E series,
enhancing by the high waveform update rate of 120,000wfm/sec, Window Zoom and Peak Search, becomes the optimal choice of the
economical and multi-function mixed domain oscilloscope.
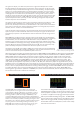
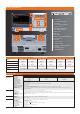
The right screen display is an often seen spectrum from a general oscilloscope's FFT. The left
boundary started from DC (low frequency signal) and the maximum frequency on the right is half
of the sample rate (can be extended to the right or even out of the boundary). The Span setting for
spectrum can only be switched by fixed 1-2-5 multiplying factors. Therefore, users can't set Span
according to their requirements that is extremely inconvenient for the operation. In fact, switching
multiplying factor is to conduct Zoom In/Out calculation on the original FFT spectrum and the
sample rate remains the same during the calculation process. Users can easily encounter the upper
and lower boundary limits that is totally different from the general spectrum analyzer in terms of
operational experience. Most importantly, no matter how setting is changed the important fmax
and fmin of spectrum can't be identified.
The right screen display is the FFT spectrum from a well-known oscilloscope manufacturer. It also
provides Span setting (adjustable 1-2-5 multiplying factor) but the result is the same as the
previous case, which only conducts Zoom In/Out calculation on FFT spectrum and FFT calculation
points have not increased. This method is absolutely unhelpful on increasing frequency resolution.
Therefore, its fmax and fmin can't be identified as well.
Users will see fmax and fmin appearing on the screen alternatively if the conventional swept tuned
spectrum analyzer is used to conduct the measurement on the previous signal. The reason is that
each frequency component is not obtained at the same time frame and it will take a longer time to
process.
MDO-2000E also provide the frequency response analysis function (Bode plot). The FRA software
can be directly downloaded from GW Instek website. Via arbitrary waveform generator, oscilloscope,
and FRA software, users can obtain DUT's FRA characteristic curve plot. FRA has a very wide
application range, including product circuit and component performance verification and analysis
such as Feedback of Circuit Design, Filter Design, Amplifier Design, Resonant Circuit Design, Cable
Frequency Response, and Signal Transformer Performance. Via FRA, users can preliminarily verify
product and analyze component's characteristics without the expensive instrument.
The frequency range of FRA is from 20Hz to 25MHz; the number of test point can be selected from
10 to 90 points per decade. After completing the Bode plot, users can select measurement curve by
Cursor so as to retrieve each point's amplitude and phase on the curve.