
User guide

GAD-201G user manual
11
5. OPERATING INSTRUCTIONS
1) Power on
a. Set the POWER switch to “OFF” position.
b. Check zero setting—If offset, adjust the pointer to zero by using
a small screwdriver.
c. Set the POWER switch to “ON” position.
2) Before applying an input signal
The instrument would be damaged by any applied signal which has an
excessive input voltage larger than 350Vrms. Make sure the input
voltage of the signal is less than 350Vrms.
3) AC voltage measurement
a. The range will be selected automatically when a signal is
connected to the input terminal, and the corresponding pilot
lamps are lighting on.
b. The reading value is obtained above one third of scale of meter
at least.
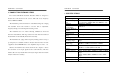
4) The decibel scale
The numerals under the pilot lamps correspond to the decibel (dB)
scale that ranges from 0 to +50dB. The decibel numerals correspond
to the voltage scale that ranges from 1V to 300V. If the range indicates
300mV to 1mV, it is necessary to add -60dB to the mentioned decibel
value.
GAD-201G user manual
12
5) Distortion measurement
In order to reject the fundamental harmonics, the distortion meter is
required the adjustment of the notch filter frequency. The instrument
provides Automatic Level Control (ALC) and automatic
synchronization, but it is required to adjust the frequency for
continuous measuring function.
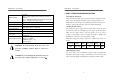
a. Use FREQUENCY RANGE selector to set the input basic
fundamental frequency range to :
× 1
………………20Hz to 200Hz
× 10
…………… 200Hz to 2kHz
× 100
…………. 2kHz to 20kHz
b. Use TUNING FREQ. knob (15), the push buttons “HIGH”(13)
and “LOW”(14) to minimize the reading value of the meter.
c. When the basic frequency of the input signal is equal to the
fundamental frequency, the lamps of the TUNING FREQ. is on.
Turn the knob to the left (the pilot lamp of “HIGH” is on) or to
the right (the pilot lamp of “LOW” is on) to increase or
decrease the fundamental frequency, then turn off two lamps.
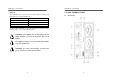
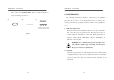
d. Connect the oscilloscope to X/Y output terminal, when the
pointer of the meter indicates the full scale position on 100%
range, the Lissajous’ figures can be observe as shown on the
Fig. 3 (a) below.