
Operating System Software Instruction Manual
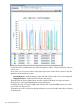
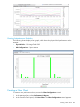
Viewing Performance Over Time
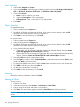
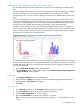
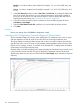
The following charts display line graphs, which show performance over time:
• Physical Disks – I/O Time and Size Distribution
• Physical Disks – Space
• Physical Disks – Performance Statistics
• Ports – Total Throughput for Disk, RCFC, and RCIP Ports
• Ports – I/O Time and Size Distribution
• Ports – Performance Statistics
• CPGs – Space
• VLUNs – I/O Time and Size Distribution
• VLUNs – Performance Statistics
• Virtual Volumes – Space
• Virtual Volume Set – QoS
• Domain — QoS
• Controller Node – CPU Performance
• Controller Node – Cache Performance
• Logical Disks – I/O Time and Size Distribution
• Logical Disks – Space
• Logical Disks – Performance Statistics
Viewing Performance 363