
Reference Guide

Full Command and Function Reference 3-59
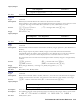
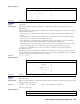
Command:
DIAGMAP
1 1
0 2
<< X<<EXP(X) >> >>→,
or
DIAGMAP([[1,1],[0,2]],exp(X))
Result:
EXP 1( ) EXP 1( )– EXP 2( )+
0 EXP 2( )
DIFF
Type: Command
Description: Displays a menu or list containing the CAS commands for differential calculus, including
commands for working with series.
Access: Catalog, …µ
Flags: If the CHOOSE boxes flag is clear (flag –117 clear), displays the operations as a numbered list. If
the flag is set, displays the operations as a menu of function keys.
See also: ALGB, ARIT, CONSTANTS, EXP&LN, INTEGER, MAIN, MATHS, MATR, MODULAR,
POLYNOMIAL, REWRITE, TESTS, TRIGO
DIFFEQ
Type: Command
Description: Differential Equation Plot Type Command: Sets the plot type to DIFFEQ.
When the plot type is DIFFEQ and the reserved variable EQ does not contain a list, the initial
value problem is solved and plotted over an interval using the Runge–Kutta–Fehlberg (4,5)
method. The plotting parameters are specified in the reserved variable PPAR, which has the
following form:
{ (
x
min
, y
min
) (
x
max
, y
max
)
indep res axes ptype depend
}
For plot type DIFFEQ, the elements of PPAR are used as follows:
• (xmin, ymin) is a complex number specifying the lower left corner of PICT (the lower left
corner of the display range). The default value is (–6.5,–3.1) for the HP 48gII and (–6.5,–3.9)
for the HP 50g and 49g+.
• (xmax, ymax) is a complex number specifying the upper right corner of PICT (the upper right
corner of the display range). The default value is (6.5,3.2) for the HP 48gII and (6.5,4.0) for the
HP 50g and 49g+.
• indep is a list, { X x
0
x
f
}, containing a name that specifies the independent variable, and two
numbers that specify the initial and final values for the independent variable. The default values
for these elements are { X 0 xmax }.
• res is a real number specifying the maximum interval, in user-unit coordinates, between values of
the independent variable. The default value is 0. If res does not equal zero, then the maximum
interval is res. If res equals zero, the maximum interval is unlimited.
• axes is a list containing one or more of the following, in the order listed: a complex number
specifying the user-unit coordinates of the plot origin, a list specifying the tick-mark annotation,
and two strings specifying labels for the horizontal and vertical axes. If the solution is real-
valued, these strings can specify the dependent or the independent variable; if the solution is
vector valued, the strings can specify a solution component:
–
0 specifies the dependent variable (X)
–
1 specifies the dependent variable (Y)
–
n specifies a solution component Y
n