
Hitachi Dynamic Link Manager Software Users Guide for Windows (6.6) (HIT5201-96005, April 2011)


2. HDLM Functions
45
2.11.1 Types of Collected Logs
HDLM collects information on detected errors and trace information and stores it into
the integrated trace file, trace file, error logs and event logs. You can use the error
information to examine the status of an error and analyze the cause of the error.
Information regarding a Windows system being down is output to a system memory
dump file.
A system memory dump file is a file to which the system memory data is output when
a Windows system is down. Specify the following procedure to output the system
memory dump file.
Click Control Panel, System, Startup/Shutdown, Write Debugging Information is
chosen with Recovery, and then choose Kernel Memory Dump or Complete
Memory Dump.
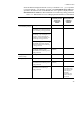
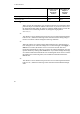
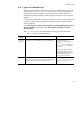
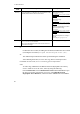
Table 2-7: Types of Error Information describes the types of error information.
Table 2-7: Types of Error Information
Log
name
Description Output destination
Integrated
trace file
Operation logs for the HDLM commands and HDLM GUI The default file path is
drive-for-program-installation
:\P
rogram
Files
#1
\HITACHI\HNTRLib2\s
pool\hntr2
n.log (n indicates a
file number)
To specify the output destination
folder and the file prefix for the
integrated trace file, use a Hitachi
Network Objectplaza Trace
Library (
HNTRLib2) utility.
Trace file Trace information on the HDLM manager is collected at the
level specified by the user. If an error occurs, you might need
to change the settings to collect trace information.
The trace file name is
\Program
Files\HITACHI\DynamicLinkM
anager\log\hdlmtr[1-64].lo
g
#2