
Medical Archive Solutions User Guide


HPMA User Guide
40
HP Medical Archive
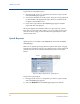
To generate an immediate report:
1. Navigate to the service or component you want to report on. The
item’s Overview page appears.
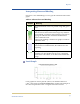
2. Scroll to the attribute you want to chart. If reports can be generated
for the attribute, the appropriate report button is available at the
far right of the attribute’s row.
3. Click on the report button. The Reports page appears and the
requested chart is displayed.
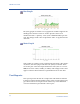
The report displays the attribute’s data over the past hour, a preset
time span. To view other time ranges, or to see a wider (zoom out) or
narrow (zoom in) range of time use either the Quick Reports or the
custom report form.
Quick Reports
Quick reports are available on the Reports tab, from both the Chart
and Te x t pages.
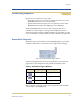
There are six options specifying the time span for the report, ranging
from the last 5 minutes to the last year. Quick reports can be generated
with the selection of an attribute and then the push of a time span
button.
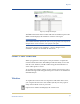
Figure 22: Report Request Form—Quick Reports
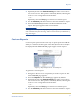
To generate a quick report:
1. Navigate to the service or component you want to report on. The
item’s Overview page appears.
2. Select the Reports tab. The Charts page appears by default.