
Medical Archive Solutions User Guide


41
HP Medical Archive
Reports
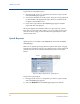
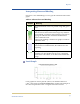
3. Optionally deselect the Vertical Scaling check box to force the Y-
axis to start at zero. This option is selected by default, allowing the
Y-axis to cover a range that best fits the data.
—or—
Optionally select the Text page to obtain a text format report.
4. Use the Attribute pull-down menu to select the attribute to report.
5. Select the Quick Query button for the desired duration of the
report. The report appears after a few moments.
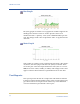
Although the Content frame may update fairly quickly, charts can take some
time to tabulate and form the image. Allow several minutes for tabulation of
long time ranges.
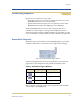
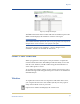
Custom Reports
Custom reports present in the same way as quick reports but add the
ability to customize the time span of the data (down to the second) to
be displayed. Both Chart and Text pages support custom reports.
Figure 23: Report Request Form—Custom Reports
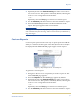
To generate a custom report:
1. Navigate to the service or component you want to report on. The
item’s Overview page appears.
2. Select the Reports tab. The Charts page appears by default.
3. Optionally deselect the Vertical Scaling check box to force the Y-
axis to start at zero. This option is selected by default, allowing the
Y-axis to cover a range that best fits the data.
—or—
Optionally select the Text page to obtain a text format report.
4. Use the Attribute pull-down menu to select the attribute to report.