
Medical Archive Solutions User Guide


43
HP Medical Archive
Reports
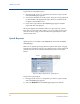
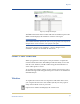
Interpreting Lines and Shading
Charts use color and shading to convey specific information about the
graph.
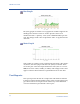
Level Graph
Level graphs are used to plot the values of an attribute that has a
“unit” value (such as Local Clock Rate Error, in ppm). The changes in
the value are plotted in “bins” at regular intervals over time.
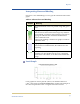
Table 6: Chart Colors and Shading
Sample Meaning
Reported attribute values are plotted using dark green
lines.
Light green shading around dark green lines indicates
that the actual values in that time range vary and have
been “binned” together for faster plotting. The range in
light green indicates the maximum and minimum
values within the “bin”.
Light brown shading is used for bar graphs to indicate
volumetric data.
Light purple shading indicates that the attribute value
at that time was indeterminate; the attribute was not
reporting.
Blank areas (white, no data plotted) indicate that the
attribute was unavailable. The service or component
was known to be offline, so no data exists for that time
range.