
HP 39gs_40gs_Mastering The Graphing Calculator_English_E_F2224-90010
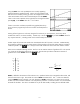

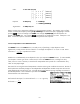


Obtaining coefficients from the fit model
The function
PREDY from MATH gives a predicted y value using the last line of best fit that was calculated.
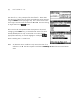
This means that you must use the
SYMB view to ensure that your set of data is the only one ed and
make sure
SYMB SETUP is set to the correct fit model, and also use the PLOT screen and the key to
ensure that your set of data was the last one graphed and that it has had its curve of best fit displayed. Until
the curve has been displayed, the coefficients are not available or, worse, might belong to another data set.
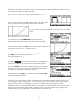
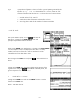
If you want to gain access to the
PREDY function algebraically then the simplest way to do this is to enter
F1(X)=PREDY(X) into the Function aplet, highlight it and press . The equation will be transferred and
can then be analyzed using the normal Function tools.
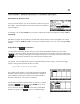
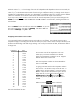
If you want individual coefficients they can also be obtained from the chosen fit model algebraically. For
example, if the line of best fit is
ym X b = * + and the fit line is showing in the SYMB screen as below then the
calculations shown right will give the slope and y-intercept.
PREDY (0)
=
m*0 + b
= b
m b) m
and PREDY (1) − PREDY (0) = (*1 + − (*0 + b)
mb=+− b
= m
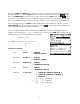
Finding Fit Coefficients
Linear -
m*X+b b = PREDY(0)
m =
PREDY(1)-PREDY(0)
Logarithmic -
m*LN(X)+b b = PREDY(1)
m =
PREDY(e)- PREDY(1)
Exponential -
b*EXP(m*X) b = PREDY(0)
m =
LN(PREDY(1)/PREDY(0))
Power -
b*X^m b = PREDY(1)
m =
LN(PREDY(e)/PREDY(1))
Quadratic -
a*X^2+b*X+c a = (PREDY(2)-2*PREDY(1)+PREDY(0))/2
b =
(PREDY(2)+4*PREDY(1)-3*PREDY(0))/2
c =
PREDY(0)
−1
⎡
a
⎤⎡
001
⎤ ⎡
PREDY
(0)
⎤
⎢
⎥⎢ ⎥ ⎢
or,
⎢
b
⎥⎢
111
⎥ ⎢
PREDY
(1)
⎥
= ×
⎥
⎢
c
⎥⎢
421
⎥ ⎢
PREDY
(2)
⎥
⎦
⎣
⎦⎣ ⎦ ⎣
135