
HP 39gs_40gs_Mastering The Graphing Calculator_English_E_F2224-90010

eg. 2 A population of bacteria is known to follow a growth pattern governed by the
equation
N = N e
kt
; t ≥ 0
. It is observed that at t = 3 hours, there are 100
0
colonies of bacteria and also that at t = 10 hours there are 10 000 colonies.
i. Find the values of
N
0
and of k.
ii. Predict the number of bacteria colonies after 15 hours.
iii. How long does it take for the number of colonies to double?
i. Find
N
0
and k.
and enter the
data given. Change to the
SYMB SETUP view and
specify an Exponential model for the data.
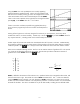
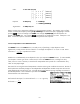
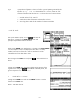
Start up the Statistics aplet, set it to
Either use the
VIEWS Auto Scale option, or change to the PLOT SETUP
view and adjust it so that it will display the data. This is not really
needed, since the line of best fit is what we need and it will be
calculated even if the data doesn’t show.
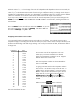
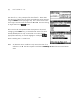
Now change to the
PLOT view and press . Wait while the line
draws.
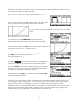
Change to the
SYMB view, move the highlight to the equation of the
regression line and press
. Rounded to 4 decimal places, this
⋅
⋅
gives an equation of
N = 13 8950 e
0 6579 t
.
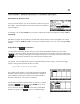
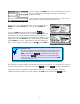
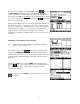
ii. Predict N for t = 15 hours.
Change to the
HOME view and use the PREDY function or use the
facilities in the
PLOT view.
Result: 268 269 colonies.
139