
HP 39gs_40gs_Mastering The Graphing Calculator_English_E_F2224-90010


Simultaneous
Connect
Axes
Labels
Grid
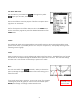
The first option
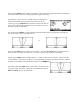
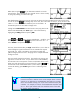
Simult controls whether each graph is drawn separately (one after the other) or whether they
are all drawn at the same time, sweeping from left to right on the screen.
My preference is to turn this off. I find that if there are more than two
functions defined then drawing them all at the same time can be
confusing. Turning off
Simult means that they are drawn one after the
other, in the order that they are defined. This is obviously a bit slower
but makes it easier to understand.
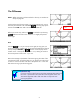
The second option
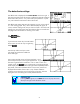
Connect controls whether the separate dots that make up a graph are connected with
lines or left as dots. This is very seldom of use.
vs…
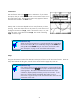
The third option
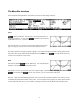
Axes controls whether axes are drawn. The fourth Inv. Cross controls the appearance of
the cursor that is moved by the arrow keys. It is best if you try this one yourself to see the effect.
The fifth option
Labels controls whether labels (‘X’, ‘Y’) and a scale are put on the axes. The only time this
causes problems is if the scale is an odd one, causing the labels to have too many decimal places. If desired
this effect can be offset by setting fixed decimal places in the
MODES view.
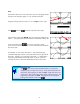
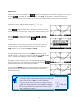
The sixth and last option
Grid causes a grid of dots to be drawn on the
screen (see right). The density of the grid is controlled by the values of
Xtick and Ytick. This can be quite useful.
51