
HP 39gs_40gs_Mastering The Graphing Calculator_English_E_F2224-90010


Plot-Detail
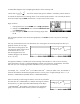
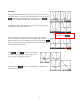
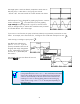
Choosing Plot-Detail from the menu splits the screen into two halves and
re-plots the graph in each half. The right hand side can now be used to
without affecting the left screen. The idea is that you on
the left screen and the result appears on the right screen.
For example a Box zoom shows the result on the right allowing easy
comparison of ‘before’ and ‘after’ views.
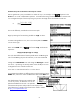
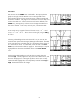
The left hand graph is always the active one, with results of actions
shown on the right. We can now use the left graph again to zoom in on
another section of interest, or alternatively, press the key under the
label. This switches the right hand graph onto the left screen so that you
can perform progressive zooms.
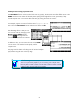
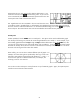
Using
or the menu you can then find
or examine points of interest. Alternatively you can
zoom in again using another Box zoom.
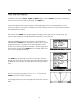
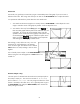
Any of the normal
tools such as Signed Area or Extremum can
be used in this split screen.
A
available except .
ll the normal function tools are
86