
HP 3PAR Management Console 4.5.1 Software User Guide


Creating a Virtual Volume Set QoS Report
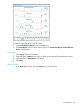
The Virtual Volume Set QoS report displays read, write, and total read/write counts in various
service time buckets. Charts can be generated for values over a time interval or at a specified time.
Each access type is shown in a different color on the same chart. The X-axis (category) represents
time, and the Y-axis (value) indicates an access count or access time, depending on the type of
chart.
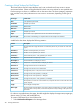
Y-Axis UnitsChart Type
I/O operations per second.IOPs
Kilobytes per second.Bandwidth
Milliseconds.Service Time
Milliseconds.Wait Time
Kilobytes per second.I/O Size
The number of I/O requests that were not serviced due to a full queue.Reject
The number of outstanding I/O requests at the time the sample was collected.Queue Length
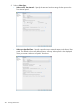
A table below the charts displays the following statistics:
DescriptionColumn
The date and time usage information was collected. (Shown only for values over time chart
types.)
Time
Number of read operations per second.Read IOPs/s
Number of write operations per second.Write IOPs/s
Total number of (read + write) operations per second.Total IOPs/s
Read bandwidth in kilobytes per second.Read KBytes/s
Write bandwidth in kilobytes per second.Write KBytes/s
Total (read + write) bandwidth in kilobytes per second.Total KBytes/s
Average read service time in milliseconds.Read Svct ms
Average write service time in milliseconds.Write Svct ms
Average total (read + write) service time in milliseconds.Total Svct ms
Average size of read operations, in kilobytes.Read I/O Size
Average size of write operations, in kilobytes.Write I/O Size
Average size of (read + write) operations, in kilobytes.Total I/O Size
The rejected I/O count. This is the number of I/O requests that were not serviced due to full
queue response.
Reject
Queue length at sample time.Length
The percentage of time the object is busy (has at least one outstanding I/O request). For RCFC
ports, the value is always 100%, as the read requests are always waiting in the queue to be
processed.
Wait Length
For values at a specified time chart types, the table might also display the target name, target type,
domain name, I/O limit, and bandwidth limit.
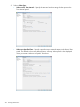
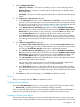
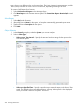
To create a QoS Report for a Virtual Volume Set:
1. Select Performance & Reports in the Manager Pane.
416 Tracking Performance