
HP 3PAR Management Console 4.5.1 Software User Guide
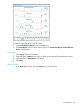

type is shown in a different color on the same chart. The X-axis (category) represents time, and the
Y-axis (value) indicates an access count or access time, depending on the type of chart.
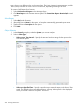
To create a QoS Report for a Domain:
1. Select Performance & Reports in the Manager Pane.
2. Click New Report in the Common Actions panel. The Create New Report: Domain QoS wizard
appears.
Select Report
1. Select QoS under Domains.
2. (Required) Enter a Name for the report, or keep the automatically generated report name.
3. (Optional) Enter a Description for the report.
4. Click Next.
Object Selection
1. In the General group box, select the System you want to analyze.
2. Select a Chart Type:
• Values over a Time Interval – Specify the start and end time range for the report in the
Time Interval panel.
• Values at a Specified Time – Specify a specific time to create the report in the Point-in-Time
panel. The default is the current date and time. A Group Values panel is also displayed
when you create a Values at a Specific Time chart.
420 Tracking Performance