
HP 3PAR Management Console 4.5.1 Software User Guide
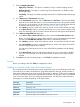


Creating a Controller Node CPU Performance Report
The Controller Node CPU Performance report displays CPU time, interrupts, and context switches
in various service time buckets. CPU time is displayed as a percentage of user, system, and idle
mode, with each mode shown in a different color on the same chart. Charts can be generated for
values over a time interval or at a specified time. The X-axis (category) represents time, and the
Y-axis (value) indicates a percentage or number, depending on the type of chart.
Y-Axis UnitsChart Type
Percentage of time in user, system, and idle mode.CPU Time
Number of interrupts per second.CPU Interrupts
Number of context switches per second.CPU Context Switches
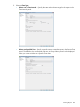
A table below the charts lists the chart data time increments within the selected time interval. For
values at a specified time chart types, the table may also contain the node number and CPU
number.
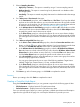
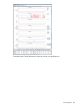
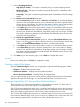
Controller Node CPU Performance report for values over a time interval:
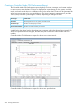
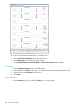
Controller Node CPU Performance report for values at a specified time:
422 Tracking Performance