
HP 3PAR Management Console 4.5.1 Software User Guide


3. Select a Sampling Resolution:
• High (Every 5 minutes) – The report is created by using a 5-minute sampling interval.
• Medium (Hourly) – The report is created using hourly data stored in a database within
the storage system.
• Low (Daily) – The report is created using daily data stored in a database within the storage
system.
4. For a Values over a Time Interval chart type:
a. In the Time Interval group box, select a Start Time and End Time. If you keep the default
end time as the current date and time, you can select the start time to be a specific number
of hours prior to the end time. You also have the option to select a specific date and time
for both the start and end times, see “Time Interval Group Box” (page 444).
b. In the Nodes group box, select which nodes to include. You must select at least one node.
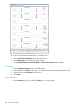
c. In the Show Charts group box, select the checkboxes for one or more charts to display:
Access Count, Hit Percent, Locked Blocks, Page States, Delay Ack, Dirty Pages, and Max
Dirty Pages. At least one chart type must be selected. The default charts are Access Count,
Hit Percent, and Locked Blocks.
5. For a Values at a Specified Time chart type:
a. In the Point in Time or Date and Time group box, select the Current date and time radio
button, or click the icon to select a date and time. If you have selected a specific date
and time, the Selected date and time radio button is automatically selected.
b. In the Nodes group box, select which nodes to include. You must select at least one node.
c. In the Show Charts group box, select the checkboxes for one or more charts to display:
Access Count, Hit Percent, Locked Blocks, Page States, Delay Ack, Dirty Pages, and Max
Dirty Pages. At least one chart type must be selected. The default charts are Access Count,
Hit Percent, and Locked Blocks.
6. Click Next to go to the Summary page, or click Finish to complete the wizard.
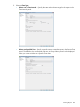
Summary
Review your settings, then click Finish to complete the wizard.
Creating a Logical Disks Report
Using the Create New Report wizard, you can generate a report for the following types of data:
• LD Space – Displays historical space data.
• Performance Statistics – Displays historical performance data.
• IO Time and Size Distribution – Displays historical histogram data.
Once you select the type of report you want to generate, a default report Name and Description
appears to the right side of the page. You can keep the default text or provide your own.
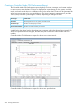
Creating a Logical Disks I/O Time and Size Distribution Report
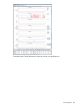
The Logical Disks I/O Time and Size Distribution report displays two charts: I/O Time and I/O
Size for access counts over a time interval or at a specified time.
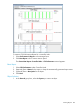
The I/O Time report displays the read, write, or combined read and write access count for service
times within the specified interval. Each service time is shown in a different color on the same chart.
The X-axis (category) represents time, and the Y-axis (value) indicates the access count.
The I/O Size report displays the read, write, or combined read and write access count for the I/O
sizes within the selected range. Each I/O size is shown in a different color on the same chart. The
X-axis (category) represents time, and the Y-axis (value) indicates the access count.
430 Tracking Performance