Performance factors for HP ProLiant Serial Attached SCSI Technology brief, 2nd edition Introduction......................................................................................................................................... 2 HDD controller technologies .............................................................................................................. 2 HDD interface technologies ........................................................................................................
Introduction Enterprise-class hard disk drives (HDD) must meet the maximum reliability and scalable performance goals of the 24/7 enterprise environment. While every minute of server downtime can prove costly, even a server’s slow performance can increase your operating costs. Hard disk controllers, interfaces, and drives have evolved to address the reliability and performance issues of the enterprise storage system.
HDD interface technologies Since the days of Advanced Technology Attachment (ATA, also known as Integrated Drive Electronics or IDE), the server industry has transitioned through several HDD interface technologies: Small computer system interconnect (SCSI) Serial Attached ATA (SATA) Serial Attached SCSI (SAS) Table 1 lists the key characteristics of these HDD interface technologies. Table 1.
The AFR is less applicable for smaller systems but is meaningful for high-density infrastructures with thousands or hundreds of thousands of drives. SAS drives, particularly small form factor (SFF) SAS drives, typically have the lowest AFR. Another important factor to HDD performance is seek time, or the time from the initiation of a read or write action until the time a data transfer begins.
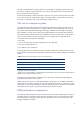
Performance comparison between SATA and Midline SAS drives Systems supporting SAS can configure a mix of SAS and SATA drives, but you can more easily achieve your performance goals using SAS drives. You cannot mix SATA and SAS drives within a logical drive. Figures 1 through 3 are plots of performance data from benchmark tests of SATA drives and Midline SAS drives using the following configuration: System—HP StorageWorks D2600 Modular Smart Array SAS Controller—HP Smart Array P411, firmware version 3.
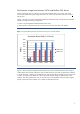
Figure 2. Sequential Write operations with HP Smart Array P411 Controller, RAID 0 Sequential Write, RAID-0, 12 Drives 1800 1600 MiB/s 1400 1200 1000 Midline SATA 800 Midline SAS 600 400 200 0 4KiB 64KiB 256KiB 512KiB 1MiB Figure 2 illustrates that for write request sizes beginning with 256KiB, an array of midline SAS drives can write a single stream of data more than twice as fast as a similar array of SATA drives.
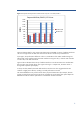
Figure 3. Random operations of SAS compared to SATA with HP Smart Array Controller P411 Controller, RAID 0 12-SAS-7200, P411, fw:3.50, 512MB, R0(256KB), 1-D2600, 1LD RAID-0 Random Performance, P411 12 - 1TB 7.2K 6Gb Midline SAS vs 12 - 1TB 7.2K 3Gb SATA 160% 100%= 7.
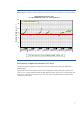
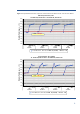
Figure 4. Sequential Read and Write comparison of ten10K SFF drives RAID-0 with ten 15K SFF drives RAID-0 1x10-Drv, P411, fw:3.50, 512MB, R0(256KB), 1-D2700, 1LD RAID-0 Sequential Read; P411 10-146GB 15K, 6Gb SFF SAS vs 10-146GB 10K, 6Gb SFF SAS 150% Relative Performance - ( % ) 140% 130% 120% 110% 100% 100%= 10K rpm 90% 80% 70% 60% 50% 64KiB SEQ READ 256KiB SEQ READ 512KiB SEQ READ 1MiB SEQ READ 1x10-Drv, P411, fw:3.50, 512MB, R0(256KB), 1-D2700, 1LD 1x10-Drv, P411, fw:3.
Figure 5 below illustrates that a RAID-0 array of ten 15K rpm SFF SAS drives achieves between 35% and 45% more 4KiB Random Read IOPS than a RAID-0 array of ten 10K rpm SFF SAS drives. The figure also shows that when running a mixture of 33% 4KiB Random Write and 67% 4KiB Random Read I/O, ten SFF 15K rpm drives achieves between 25% and 45% more IOPS. Once again, drives spinning only 5K rpm faster can result in a significant performance increase. Figure 5.
Figure 6. Sequential Read comparison of four 10K SFF drives RAID-5 with four 15K SFF drives RAID-5. 1x4-Drv, P411, fw:3.50, 512MB, R5(256KB), 1-D2700, 1LD RAID-5 Sequential Read Performance; P411 4-146GB 15K, 6Gb SFF SAS vs 4-146GB 10K, 6Gb SFF SAS 160% Relative Performance - ( % ) 140% 120% 100% 100%= 10K SFF; fw:3.50 80% 60% 40% 64KiB SEQ READ 256KiB SEQ READ 512KiB SEQ READ 1MiB SEQ READ 1x4-Drv, P411, fw:3.
Figure 7. Write performance comparison of four 10K SFF drives RAID-5 with four 15K SFF drives RAID-5. 1x4-Drv, P411, fw:3.50, 512MB, R5(256KB), 1-D2700, 1LD RAID-5 Sequential Write Performance; P411 4-146GB 15K, 6Gb SFF SAS vs 4-146GB 10K, 6Gb SFF SAS 160% Relative Performance - ( % ) 140% 120% 100% 100%= 10K SFF; fw:3.50 80% 60% 40% 64KiB SEQ WRITE 256KiB SEQ WRITE 512KiB SEQ WRITE 1MiB SEQ WRITE 1x4-Drv, P411, fw:3.
Figure 8. Random performance comparison of ten10K SFF RAID-5drives and ten15K SFF RAID-5drives 1x10-Drv, P411, fw:3.50, 512MB, R5(256KB), 1-D2700, 1LD RAID-5 Random Performance; P411 10-146GB 15K 6Gb SAS SFF vs 10-146GB 10K 6Gb SAS SFF 160% Relative Performance - ( % ) 140% 120% 100% 100%= 10K rpm SFF SAS 80% 60% 40% 4KiB RAN READ Aligned 4KiB RAN WRITE Aligned 4KiB OLTP Aligned 64KiB RAN READ Aligned 64KiB RAN WRITE Aligned 1MiB RAN READ Aligned 1MiB RAN WRITE Aligned 1x10-Drv, P411, fw:3.
Figure 9. Sequential Read performance comparison between RAID-6 and RAID-5SFF drives. P411, fw:3.50, 512MB, R6(256KB), 1-D2700, 1LD RAID-61x4-Drv, vs RAID-5, Sequential Read Performance 4-146GB 15K 6Gb SFF SAS, P411 160% Relative Performance - ( % ) 140% 120% 100%= RAID-5 100% 80% 60% 40% 4KiB SEQ READ 64KiB SEQ READ 256KiB SEQ READ 512KiB SEQ READ 1x4-Drv, P411, fw:3.
Figure 10. Sequential Write performance comparison between RAID-6 and RAID-5 SFF drives 1x4-Drv, P411, fw:3.50, 512MB, R6(256KB), 1-D2700, 1LD RAID-6 vs RAID-5, Sequential Write Performance 4-146GB 15K 6Gb SFF SAS, P411 160% Relative Performance - ( % ) 140% 120% 100%= RAID-5 100% 80% 60% 40% 64KiB SEQ WRITE 256KiB SEQ WRITE 512KiB SEQ WRITE 1MiB SEQ WRITE 1x4-Drv, P411, fw:3.
Figure 11. Random performance comparison between RAID-6 and RAID-5 SFF drives. 1x10-Drv, P411, fw:3.50, 512MB, R6(256KB), 1-D2700, 1LD RAID-6 vs RAID-5, Random Performance 10-146GB 15K 6Gb SFF SAS, P411 150% Relative Performance - ( % ) 140% 130% 120% 110% 100%= RAID-5 100% 90% 80% 70% 60% 50% 4KiB RAN READ Aligned 4KiB RAN WRITE Aligned 4KiB OLTP Aligned 64KiB RAN READ Aligned 64KiB RAN WRITE Aligned 1MiB RAN READ Aligned 1MiB RAN WRITE Aligned 1x10-Drv, P411, fw:3.
P800 controller’s 3Gb, four-lane SAS port is saturated. Performance no longer increases with additional drives. Utilizing 6Gb technology, the P411 controller continues to scale beyond arrays of eight drives until reaching a saturation point with an array of sixteen or more drives. Maximum performance is approximately 2000 MiB/s. Figure 12.
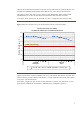
Figure 13. RAID- 256 KiB Sequential Write RAID-0, 256KiB Sequential Write Transfter Rate ( MiB/s ) 2500 2000 1500 P800, 3Gb 1000 P411, 6Gb 500 0 Drives 1 2 4 6 8 10 12 16 20 24 Performance comparisons based on platter speed The charts in Figure 14 below compare sequential read performance between 10K (rpm) and 15K SFF SAS drives operating as a 6-drive array with an HP Smart Array P800 controller using RAID 5.
Figure 14. Performance comparison: 10K versus 15K RPM, RAID 5 controller and 6 SFF SAS drives B: Sequential read, Q4 MiB/s MiB/s A: Sequential read, Q1 D: Sequential read, Q16 MiB/s Mib/s C: Sequential read, Q8 F: Random IOPS IOPS MiB/s E: Sequential read, Q32 10K RPM SAS HDD 15K RPM SAS HDD As indicated by the charts, 15K drives show a significant advantage where the requested data blocks are stripe size (64 KB) or larger.
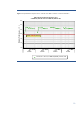
Figure 15. Random read performance, RAID 5 4 KB Random Read 2500 64 KB Random Read 512 KB Random Read 2000 IOPS 1500 1000 500 No. of drives 3 4 5 6 7 8 3 4 10K HDD & P400 controller 5 6 7 8 3 4 5 6 7 8 15K HDD & 6402 controller As indicated in Figure 15, 15K drive arrays consistently provide higher random read IOPS than 10K drive arrays. Also, overall performance scales with array size (number of drives).
Table 3. Comparison of seek time and power consumption of HP SFF SAS drives Capacity/RPM 36 GB/15K 72 GB/10K 72 GB/15K 146 GB/10K Seek time: Single track Average Full stroke 0.20 ms 3.0 ms 7.0 ms 0.20 ms 4.0 ms 8.1 ms 0.20 ms 3.0 ms 7.0 ms 0.60 ms 4.1 ms 8.0 ms 5.74 watts 7.25 watts 5.96 watts 8.42 watts 6.11 watts 8.29 watts 6.31 watts 8.73 watts Power consumption: Idle Maximum All drives listed In Table 3 have a cache/buffer size of 16 MB and a transfer time of 3 Gb/s.
For more information Visit the URLs listed ed below if you need additional information. Resource description Web address QuickSpecs for HP SAS drives http://h18004.www1.hp.com/products/quickspecs/12244_na/12 244_na.html “Serial ATA technology” technology brief http://h20000.www2.hp.com/bc/docs/support/SupportManual/c0 0301688/c00301688.pdf “Serial-Attached Attached SCSI storage technology” technology brief http://h20000.www2.hp.com/bc/docs/support/SupportManual/c0 p.