
Brocade Network Advisor SAN User Manual v11.1x (53-1002167-01, May 2011)


Brocade Network Advisor SAN User Manual 791
53-1002167-01
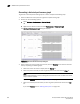
SAN Historical performance data
27
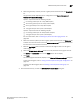
Saving a historical performance graph configuration
To save a historical performance graph configuration, complete the following steps.
1. Select the device for which you want to generate a performance graph.
2. Choose one of the following options:
• Select Monitor > Performance > Historical Graph.
OR
• Right-click the device or fabric and select Performance > Historical Graph.
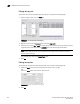
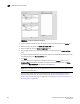
The Historical Performance Graph dialog box displays.
3. Filter the historical data by completing the following steps.
4. Select the number of results to display from the Display list.
5. Select the ports from which you want to gather performance data from the From list.
NOTE
Devices with 10GE ports must be running Fabric OS 6.4.1ltd or later to obtain the correct
TE port statistics (TX/RX).
If you select Custom, you can save the selected ports as a Favorite.
6. Select the historical period for which you want to gather performance data from the For list.
If you select Custom, you can save the selected time as a Favorite.
7. Select the granularity at which you want to gather performance data from the Granularity list.
8. Select the measure by which you want to gather performance data from the Measures list.
To select more than one measure, click the Additional Measures expand arrows and select the
check box for each additional measure.
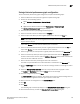
9. Enter a reference line value percentage for Tx% or Rx % Utilization.
This field is only enabled when Tx% or Rx % Utilization is selected from the Measures list.
10. Move the Row Height slider to the left to make the row height smaller or to the right to make it
bigger.
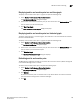
11. Select the Display tabular data only check box to only show text with no graphs or icons.
The Source and Destination icons and the Graph column do not display
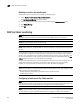
12. Save this configuration by selecting Save.
The Save Favorites dialog box displays. This enables you to save the selected configuration so
that you can use it to generate the same type of report at a later date.
13. Enter a name for the configuration in the Favorites Name field.
14. Click OK.
15. Click Apply.
The selected graph automatically displays in the Historical Performance Graph dialog box.
16. Click the close button (X) to close the HIstorical Performance Graph dialog box.