
Data Center Fabric Manager Enterprise User Manual v10.3.X (53-1001357-01, November 2009)

DCFM Enterprise User Manual 309
53-1001357-01
Generating a historical performance graph
8
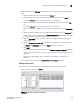
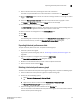
3. Select a default from the Favorites list or filter the historical data by completing the following
steps.
a. Select the number of results to display from the Display list.
b. Select the ports from which you want to gather performance data from the From list.
If you select Custom, refer to “Filtering data by ports” on page 309.
c. Select the historical period for which you want to gather performance data from the For
list.
If you select Custom, refer to “Filtering data by time” on page 310.
d. Select the granularity at which you want to gather performance data from the Granularity
list.
e. Select the measure by which you want to gather performance data from the Measures list.
To select more than one measure, click the Additional Measures expand arrows and select
the check box for each additional measure.
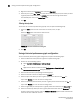
f. Move the Row Height slider to the left to make the row height smaller or to the right to
make it bigger.
g. Select the Display tabular data only check box to only show text with no graphs or icons.
The Source and Destination icons and the Graph column do not display
h. Click Apply.
The selected graph automatically displays in the Historical Performance Graph dialog box.
To save a filtered graph, refer to “Saving a historical performance graph configuration” on
page 310.
To delete user-defined graph, refer to “Deleting a historical performance graph” on
page 311.
4. Click the close button (X) to close the HIstorical Performance Graph dialog box.
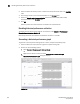
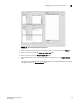
Filtering data by ports
To filter data for a historical performance graph by ports, complete the following steps.
1. Select the type of ports from the Show list.
FIGURE 114 Custom Port Selector dialog box