
Data Center Fabric Manager Enterprise User Manual v10.3.X (53-1001357-01, November 2009)

310 DCFM Enterprise User Manual
53-1001357-01
Saving a historical performance graph configuration
8
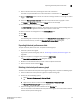
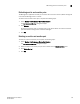
2. Right-click a device in the Available table and select Expand All.
3. Select the ports (press Ctrl or Shift and then click to select multiple ports) from which you want
to gather performance data from the Available table and click the right arrow button.
The selected ports move to the Select Ports table.
4. Click OK.
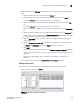
Filtering data by time
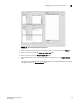
To filter data for a historical performance graph by time, complete the following steps.
1. Select the Last option and enter the number of minutes, hours, or days.
OR
Select the From option and enter the date and time.
FIGURE 115 Custom Port Selector dialog box
2. Click OK.
Saving a historical performance graph configuration
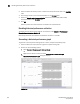
To save a historical performance graph configuration, complete the following steps.
1. Select the device for which you want to generate a performance graph.
2. Choose one of the following options:
• Select Monitor > Performance > Historical Graph.
OR
• Right-click the device or fabric and select Performance > Historical Graph.
The Historical Performance Graph dialog box displays.
3. Filter the historical data by completing the following steps.
4. Select the number of results to display from the Display list.
5. Select the ports from which you want to gather performance data from the From list.
If you select Custom, you can not save the configuration.
6. Select the historical period for which you want to gather performance data from the For list.
If you select Custom, you can not save the configuration.
7. Select the granularity at which you want to gather performance data from the Granularity list.
8. Select the measure by which you want to gather performance data from the Measures list.
To select more than one measure, click the Additional Measures expand arrows and select the
check box for each additional measure.